
Abstract
This comprehensive study meticulously evaluated six probability distribution models for the compressive strength of 24 concrete blocks, 12 with metakaolin and 12 without addition. The models analyzed were Lognormal, Gamma, Normal, Weibull, Beta, and Exponential. For blocks with metakaolin, the Lognormal distribution presented the best fit, followed by Gamma, Normal, Beta, and Weibull, while the Exponential needed to be more adequate. In blocks without metakaolin, the Gamma distribution was the most efficient, followed by Normal, Weibull, Lognormal, and Beta, with the Exponential also inadequate. The model parameters were adjusted based on the resistance frequencies estimated for each group of samples. Thus, Lognormal and Gamma performed better in predicting compressive strength, depending on the presence or absence of metakaolin. The Exponential distribution, in turn, was considered inadequate in both cases.
Keywords
Concrete; Metakaolin; Probability distributions; Characteristic compressive strength
Resumo
Este estudo avaliou seis modelos de distribuição de probabilidade para a resistência à compressão de 24 blocos de concreto, sendo 12 com adição de metacaulim e 12 sem adição. Os modelos analisados foram: Lognormal, Gamma, Normal, Weibull, Beta e Exponencial. Para os blocos com metacaulim, a distribuição Lognormal apresentou o melhor ajuste, seguida por Gamma, Normal, Beta e Weibull, enquanto a Exponencial não foi adequada. Nos blocos sem metacaulim, a distribuição Gamma foi a mais eficiente, seguida por Normal, Weibull, Lognormal e Beta, com a Exponencial também inadequada. Os parâmetros dos modelos foram ajustados com base nas frequências das resistências estimadas para cada grupo de amostras. Assim, a distribuição Lognormal e a distribuição Gamma demonstraram melhor desempenho na previsão da resistência à compressão, dependendo da presença ou ausência de metacaulim. A distribuição Exponencial, por sua vez, foi considerada inadequada em ambos os casos.
Palavras-chave
Concreto; Metacaulim; Distribuições de probabilidade; Resistência à compressão característica
Introduction
Concrete is a composite material widely used in civil engineering to construct buildings, ports, bridges, viaducts, and the paving of urban roads. When concrete is used in the form of blocks, there is an interest in these systems due to their range of applicability and the low costs associated with their preparation and application in structural systems (Chen; Li; Poon, 2018; Santos et al., 2018). In this way, the interest of academic researchers and manufacturers in technological innovations of this material is growing.
Recently, essential advances in preparing concrete from materials that are alternative to Portland cement and, at the same time, more sustainable from an environmental point of view have been reported (Chen; Li; Poon, 2018; Santos et al., 2018). Examples include the use of waste sand (Santos et al., 2018) and recycled glass (Chen; Li; Poon, 2018). Furthermore, essential advances concerning enhancing the properties of Portland cement concrete have also been reported. In this sense, additives have been used to improve the properties of Portland cement concrete. A type of additive commonly used in this material is metakaolin. This compound is formed essentially by silica (SiO2) and alumina (Al2O3) (Akinyele et al., 2017; Badogiannis; Tsivilis, 2009; Li; Li, 2002; Mirmoghtadaei et al., 2015; Rashwan; Megahed; Essa, 2015; Narmatha; Kala, 2017; Parande et al., 2008; Rezende et al., 2012). Examples of concrete properties that can be enhanced due to the use of metakaolin include characteristic compressive strength (Devi, 2015; Li; Li, 2002; Mirmoghtadaei et al., 2015; Narmatha; Kala, 2017; Parande et al., 2008); workability (Rezende et al., 2015); resistance to external agents such as sulfuric acid (Rashwan; Megahed; Essa, 2015) and chloride ions (Figueiredo et al., 2014; Medeiros et al., 2013).
In this way, probability distribution models can be a viable way to obtain important information about the factors that govern the property of interest. Marques et al. (2014) reported the performance of three probability distributions (GEV, Gumbel, and Gama) to the daily precipitation indices of 8 rainfall stations located west of Minas Gerais-Brazil. The authors’ results indicated that the Gumbel distribution presented the best performance among the considered models. Another work that evaluated the performance of probability distributions was reported by Lima, Kwon and Kim (2016). The authors showed that the beta distribution model was suitable for estimating rainfall intensity-duration-frequency estimation curves when a climate change occurs (Lima; Kwon; Kim, 2016).
Previous research (Almeida Filho et al., 2010; Tumidajski et al., 2006; Vu; Ho, 2023; Vu; Ho; Pham, 2022) reported using probability distributions to evaluate characteristic resistance to axial compression. According to Tumidajski et al. (2006), the Weibull distribution is a better representation than the normal distribution of the concrete characteristic compressive strength and can be applied to this type of data.
Vu and Ho (2023) and Vu, Ho, and Pham (2022) investigated specimen size effects on the compressive strength of concrete-building materials. The authors found that the probability distribution of the compressive strength of concrete is affected by the material’s size-dependent behavior. Expressing the probability distribution of the compressive strength of concrete through Weibull distribution functions fails to account for its size dependence, while normal and lognormal distributions can effectively describe it.
This work aimed to evaluate the suitability of six probability distribution functions (Lognormal, Gama, Normal, Weibull, Beta, and Exponential) in data on the characteristic compressive strength of a universe of 24 batches of concrete blocks, identifying the distribution that best fits the data.
Materials and methods
Initially, the estimated characteristic compressive strength of 24 batches of industrial-production concrete blocks manufactured in a company in Pernambuco-Brazil was evaluated. Half of these 24 lots were composed of cement, stone dust, metakaolin, and water, and the other half did not have the addition of metakaolin (Table 1).
The blocks supplied by the company were made using stone powder instead of sand and gravel. This waste preserves the mechanical characteristics desired for the concrete block and reduces the environmental impact generated by the manufacture of aggregates (Nisz et al., 2017).
The compressive strength test, to determine the estimated value of the samples’ characteristic strength (fbk), was carried out following NBR 12118 (ABNT, 2013). According to NBR 6136 (ABNT, 2016), six specimens were selected from each batch analyzed to serve as sampling.
The Lognormal, Gamma, Normal, Weibull, Beta, and Exponential functions were used to evaluate the adequacy of the probability distribution functions related to studying the mechanical property of compressive strength. The parameters of these functions were adjusted to the estimated compressive strength frequencies (fbk) for the 24 concrete block lots.
The following adequacy tests were used to evaluate the accuracy of the probability distribution function (PDF) about the observed compressive strength data: The chi-square test (X²), Kolmogorov-Smirnov test (K-S), and the Anderson-Darling (A-D) test. According to Fernandes (2013), these are the most relevant tests, along with Cramer-Von Mises, to validate the fit of statistical distributions.
To interpret the results of adequacy tests, the degrees of freedom of each probability density function (PDF), representing the number of free values to vary in a data set, were considered, after considering the constraints imposed by the characteristics of each function, Table 2.
For the definition of the degree of freedom of a function, according to the table above, ‘n’ represents the number of observations in the data, and ‘k’ represents the number of parameters of each probability distribution function.
The selection of the most appropriate PDF was based on the following criteria: the number of suitability tests approved (all tests are preferred) and the values of the test statisticians, with smaller values indicating a better fit. In cases where several PDFs meet the criteria, the additional condition adopted was the graphical comparison of the actual and estimated cumulative probability distributions. Figure 1(a) shows the stock of industrial production batches, and Figure 1(b) shows the removal of specimens for the compressive strength test.

(a) Blocks manufactured by a partner company, (b) removal of specimens for the compressive strength test
From the results of the characteristic compressive strength (fbk) of the 24 batches of concrete blocks, the theoretical models of probability density distribution Lognormal, Gamma, Normal, Weibull, Beta, and Exponential were applied. To verify the degree of adherence of the empirical distributions to the data, the Chi-square test (X²), Kolmogorov-Smirnov (KS), and Anderson-Darling (AD) tests were used.
In this study, we adopted a significance level of 5% (α = 0.05). We assumed the null hypothesis (H0), which states that the distribution obtained by the evaluated probability density function is not different from the observed distribution. Microsoft Excel® software was used to assist in the statistical analysis.
Results and discussions
Table 3 shows the characteristic compressive strength results of the 12 batches of concrete blocks with the addition of metakaolin and the 12 batches without metakaolin. The standard deviation is calculated after obtaining the average values for each batch, 12 batches with metakaolin and 12 batches without metakaolin.
The analysis of the characteristic compressive strength results (Table 3) suggests that adding metakaolin is associated with increased strength compared to batches without this addition. Table 4 shows the sample analysis results with the addition of metakaolin to evaluate the six probability distribution models considered in this work.
Regarding statistical values, the lower the values of X² (Chi-Square), Dmax (Kolmogorov-Smirnov), and A²corr (Anderson-Darling), the smaller the difference and the more the chosen distribution fits the observed data. If they are null, it means that there is a perfect fit. If they are null, there is a perfect fit (Fernandes, 2013).
It is observed that the Lognormal, Gamma, and Normal probability distribution functions of the 12 batches, with the addition of metakaolin, showed satisfactory results in compliance with the Chi-Square (X²), Kolmogorov-Smirnov (K-S) and Anderson-Darling (A-D) tests.), because the criterion value is less than the critical value, the Weibull probability distribution met the critical value only for the Kolmogorov-Smirnov (K-S) test. The Beta distribution met the critical values of the Kolmogorov-Smirnov (K-S) and Chi-square (X²) tests. The exponential distribution did not adhere to the applied tests, obtaining a criterion value that was significant than the critical value and inadequate to represent the analyzed data.
The critical value of the Chi-Square (X²) adherence test for the Exponential probability density function is different from the other functions. This is because the Exponential function has only one estimated parameter, lambda, unlike other functions with two estimated parameters. In the exponential function, the lambda (λ) is a crucial parameter that shapes the function’s behavior and determines how quickly the exponential function decays. Larger lambda values imply faster decay, while smaller values lead to slower decay. Lambda also influences the centralization and dispersion of the distribution.
Consequently, the Exponential function is the only one with three degrees of freedom, while the others have two degrees. In this way, the Lognormal, Gamma, and Normal distributions are the most adequate since they meet the criteria of all adherence tests. The Weibull and Beta distributions are unsuitable because they only meet some adherence tests.
Figure 2 presents the real and estimated cumulative probability distribution curves to evaluate the suitability of concrete blocks’ characteristic compressive strength data by adding metakaolin.
roct- Accumulated probability distributions actual and estimated by the Lognormal, Gamma, Normal, Weibull, Beta, and Exponential distributions, respectively, for the fbk values of batches of concrete blocks with the addition of metakaolin
The Exponential distribution proved inadequate in representing the characteristic compressive strength (fbk) values of the 12 batches of concrete blocks with metakaolin because they did not meet the evaluated quality criteria. The A² parameter is the Anderson-Darling (AD) test statistic based on the difference between the empirical and theoretical cumulative probability functions (Finkler et al., 2015). As this statistic depends on the observations sorted in ascending order, the A² values will differ for the characteristic compressive strength values with and without the addition of metakaolin. Figure 3 presents the cumulative actual and estimated probability distribution curves for evaluating the adequacy of the characteristic compressive strength data of the concrete blocks with the addition of metakaolin.

Frequencies observed and estimated by the probability distributions of batches of concrete blocks with metakaolin addition
The cumulative actual and estimated probability distribution curves are observed for each model. Check that the Lognormal, Gamma, and Normal distributions present an excellent approximation to the actual probability with a significance level of 5%. Through the analysis, the graphical Weibull distribution also presented an excellent fit to the data. However, it needed to present adequate results for all adherence tests, as observed in Table 4. The graphical analysis of the beta and exponential distributions indicates that these probability distributions are inadequate for the data and cannot represent the characteristic resistance to the flexibility of the batches of concrete blocks analyzed in this study.
The analysis of Figure 3 also indicates that, due to the similarity of the behaviors of the Lognormal, Gamma, Normal, and Weibull distribution curves, it is essential that the quality criteria used in this work are used through the adherence tests in the choice of the best distribution model to guarantee the highest reliability of the results. Figure 3 shows the frequency observed for the curves obtained from all the probability distributions of the samples with the addition of metakaolin, in which the frequency intervals of the characteristic strength of each batch were considered.
The analysis of Figure 3 also indicates that, due to the similarity of the behaviors of the Lognormal, Gamma, Normal, and Weibull distribution curves, it is essential that the quality criteria used in this work are used through the adherence tests in the choice of the best distribution model to guarantee the highest reliability of the results. Figure 3 shows the frequency observed for the curves obtained from all the probability distributions of the samples with the addition of metakaolin, in which the frequency intervals of the characteristic strength of each batch were considered.
The graphical analysis shows that the Lognormal, Gamma, Normal, and Weibull distributions presently estimate curves that resemble the observed behavior of the concrete blocks’ characteristic compressive strength frequency (fbk). However, the Weibull distribution did not meet the adherence criteria used. On the other hand, the Beta and Exponential distributions show behavior that does not fit the distribution, indicating the lack of suitability to represent the observed data, corroborating the results of the probability distribution in Figure 2.
Regarding the twelve samples without adding metakaolin, Table 5 shows the results of all probability distributions considered for these concrete blocks.

Actual and estimated cumulative probability distributions by Lognormal, Gamma, Normal, Weibull, Beta, and Exponential distributions for fbk values of concrete blocks without adding metakaolin
The analysis of Table 5 indicates that the probability distribution functions Lognormal, Gamma, Normal, Weibull, and Beta presented satisfactory results, meeting the Chi-Square (X²), Kolmogorov-Smirnov (K-S), and Anderson-Darling (A-D) adherence tests), being adequate to represent the observed data.
This analysis was because the statistics values (X²), D max, and A²corr are smaller than their respective critical values, X²cri, Dcri, and A²cri. As observed in the characteristic compressive strength adhesion tests with the addition of metakaolin (Table 4), the Exponential probability distribution was not adequate to describe the characteristic compressive strength property of concrete blocks without metakaolin due to meeting the no adherence test used, with more excellent statistics values than critical values in all analyses.
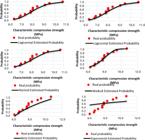
Figure 4 shows the real and estimated cumulative probability distribution curves to evaluate the suitability of the characteristic compressive strength data of batches of concrete blocks without adding metakaolin.
It is observed that the Lognormal, Gamma, Normal, and Weibull distributions present the best fits of the empirical and theoretical accumulated probabilities, able to represent the compressive strength data without the metakaolin. The beta distribution indicates a greater distance between empirical and theoretical data but is not the most indicated.
On the other hand, the exponential distribution needs to be more adequate in representing the observed data because it has a probability curve that is dissonant with the actual probability. As observed for the compressive strength values with the addition of metakaolin, Figure 5 shows the frequency observed for the curves of all six probability distributions considered to evaluate the compressive strength characteristic of the concrete samples without adding metakaolin. For this analysis, the frequency intervals observed in the data were considered for comparison with the frequency curves estimated by the probability density functions.

Frequencies observed and estimated by the probability distributions of batches of concrete blocks without adding metakaolin
Through the analysis of the empirical frequency curves and those estimated by the probability distribution functions, it can be seen that the Beta distribution presents the closest proximity to the curve of the observed data of characteristic resistance to compression, indicating the possibility of representing the behavior of this property. The Lognormal, Gamma, Norma, and Weibull functions resemble the observed data but have greater distances than those observed in the Beta distribution.
As observed for the compressive strength data with the addition of metakaolin, the Exponential distribution is inadequate to estimate the empirical data of frequency of characteristic compressive strength of concrete blocks without metakaolin, as seen in Figure 5, due to a considerable difference between the observed and estimated frequency curves.
From the results in Table 4 and Figures 2 and 3, it was possible to order the probability distributions’ results according to a classification of adequacy to the empirical data. Table 6 presents the number of adhesions that the probability distribution functions obtained for concrete blocks’ characteristic compressive strength data with metakaolin addition and the best-fit classification.
Classification of application of adhesion tests for the universe of samples of concrete blocks with the addition of metakaolin
The analysis of Table 6 indicates that the Lognormal, Gamma, and Normal distributions have 100% adherence to the tests used in this study, obtaining three adjustments each. Thus, the three distributions can be used to estimate, with greater confidence, the strength values of concrete blocks with the addition of metakaolin.
Among the distributions with 100% adherence, the Lognormal was considered the most adequate to estimate the observed data because it has the lowest criterion parameter (D max) for the Kolmogorov-Smirnov (K-S) test. This rigorous test can be used for any sample volume. According to Fernandes (2013), the Kolmogorov-Smirnov (K-S) test is more effective than the Chi-Square (X²) test.
Even though the Lognormal, Gamma, and Normal distributions can be used to represent the studied data, obtaining the estimate of the parameters may be a criterion for selecting the best model. This is because obtaining parameter estimation and probability estimation differ in difficulty. Thus, through the criterion of parsimony, the researcher can choose, among the adjusted models, the one that is simpler, more versatile, and more flexible (Neto et al., 2005).
Among the three best models determined in this study, the Gamma distribution presents the most significant application difficulty due to estimating the α and β parameters and the complexity and extension of the calculations involved. For this reason, the normal distribution and the gamma were classified as the second and third best-fit models for the empirical data.
The Beta and Weibull distributions obtained two adjustments and one adjustment to the adherence tests, respectively, appearing as the fourth and fifth best suitability to the data. However, these distributions can also be applied to estimate the data.
The Exponential distribution cannot represent the data because it does not adhere to the tests used in this research. The graphical analysis of the accumulated distributions of probability and frequencies presents an estimated behavior that is different from the observed one. Table 7 presents the number of adhesions that the probability distribution functions obtained for the characteristic compressive strength data of the concrete blocks without the addition of metakaolin and the best-fit classification.
Classification of application of adhesion tests for the universe of samples of concrete blocks without the addition of metakaolin
The analysis of Table 7 indicates that of the six probability distributions, five satisfactorily met the adherence tests with 100% adjustment. As observed for the data with the addition of metakaolin, Table 6, the Exponential distribution can only be used to estimate the characteristic compressive strength of the concrete blocks with the addition of metakaolin because it does not adhere to the tests used in this research.
Although the six probability distributions adhered 100% to the tests and could estimate the characteristic compressive strength data, they could be classified according to better suitability. The Gamma and Weibull distributions obtained the lowest criterion values in the adhesion tests, as observed in Table 5, and, therefore, have the best adjustment to the empirical data of compressive strength. The analysis of the natural and estimated cumulative probability distribution curves, Figure 3, indicates that the Beta function was the one that most distanced itself from the actual probability, even having met the adherence tests, occupying the third position.
Of the analyzed distributions, only the exponential one cannot be used to estimate the compressive strength values of the concrete blocks with and without the addition of metakaolin. However, evaluating the compressive strength of concrete blocks with different traits and materials is necessary since the observed data may not suit the probability density functions used in this study.
Conclusions
For the case study in which the concrete blocks were prepared with the addition of metakaolin, the most appropriate probability distribution to evaluate the characteristic compressive strength property was the Lognormal, followed by the Normal, Gamma, Beta, and Weibull distributions. On the other hand, the exponential distribution needed to be more suitable for studying this mechanical property for concrete blocks with the addition of metakaolin.
About the 12 batches of concrete without adding metakaolin, the Gamma and Weibull distributions were considered most appropriate for estimating strength values, followed by the Lognormal, Normal, and Beta distributions. Once again, the exponential distribution was not suitable for estimating aspects associated with the characteristic compressive strength of concrete blocks according to the adhesion tests used.
The graphical analysis of the estimated accurate cumulative probability distributions and the observed estimated frequencies proved to help evaluate the adequacy of the probability density functions to the actual data, corroborating the results obtained in the adherence tests.
The high value of the standard deviation is due to factors such as the variation in pressure in the block manufacturing machine, as well as the variation in humidity in which the blocks are manufactured, even under possible conditions of distribution curves predicted for the mechanical resistance to compression as a classification parameter.
In this way, it is possible to infer that adding metakaolin to manufacture concrete blocks is an exciting alternative for constructing structural masonry in buildings. This finding highlights the effectiveness of metakaolin in improving the mechanical strength of concrete blocks and suggests its potential to transform the construction industry, making it more efficient and sustainable.
-
LIMA, N. B. de; PONTES, M.; SILVA, D.; MANTA, R. C.; TETI, B. de S.; NASCIMENTO, H. C. B. do; SANTOS, L. B. T. dos; LIMA, N. B. de. Evaluation of probability distributions in the study of characteristic compressive strength of metakaolin concrete blocks. Ambiente Construído, Porto Alegre, v. 25, e138069, jan./dez. 2025.
References
- AKINYELE, J. O. et al. Structural behavior of metakaolin-infused concrete structure. Nigerian Journal of Technology, v. 36, n. 2, p. 331, 2017.
- ALMEIDA FILHO, F. M. et al. Hardened properties of self-compacting concrete: a statistical approach. Construction and Building Materials, v. 24, n. 9, p. 1608–1615, 2010.
- ASSOCIAÇÃO BRASILEIRA DE NORMAS TÉCNICAS. NBR 12118: blocos vazados de concreto simples para alvenaria: métodos de ensaio. Rio de Janeiro, 2013.
- ASSOCIAÇÃO BRASILEIRA DE NORMAS TÉCNICAS. NBR 6136: blocos vazados de concreto simples para alvenaria: requisitos. Rio de Janeiro, 2016.
- BADOGIANNIS, E.; TSIVILIS, S. Exploitation of poor Greek kaolins: durability of metakaolin concrete. Cement and Concrete Composites, v. 31, n. 2, p. 128–133, 2009.
- CHEN, Z.; LI, J. S.; POON, C. S. Combined use of sewage sludge ash and recycled glass cullet for the production of concrete blocks. Journal of Cleaner Production, v. 171, p. 1447–1459, 2018.
- DEVI, M. Implication of metakaolin in quarry dust concrete. International Journal of Structural and Civil Engineering Research, v. 4, n. 2, p. 171-174, 2015.
- FERNANDES, F. S. Testes de ajuste a distribuições estatísticas e métodos para estimação dos parâmetros em análises de fiabilidade Lisboa, 2013. 91f. Dissertação (Mestrado em Engenharia Mecânica) - Instituto Superior de Engenharia de Lisboa, Lisboa, 2013.
- FIGUEIREDO, C. P. et al. O papel do metacaulim na proteção dos concretos contra a ação deletéria de cloretos. Revista IBRACON de Estruturas e Materiais, v. 7, n. 4, p. 685–708, 2014.
- FINKLER et al. Comparação de funções de distribuição de probabilidades na determinação de vazão mínima anual e sazonal. Scientia cum Industria, v. 3, n. 2, p. 42–49, 2015.
- LI, J.-T. D.; LI, Z. Effects of metakaolin and silica fume on properties of concrete. ACI Materials Journal, v. 99, n. 4, p. 393–398, 2002.
- LIMA, C. H. R.; KWON, H.-H.; KIM, J.-Y. A Bayesian beta distribution model for estimating rainfall IDF curves in a changing climate. Journal of Hydrology, v. 540, p. 744–756, 2016.
- MARQUES, R. F. de P. V. et al. Performance of the probability distribution models applied to heavy rainfall daily events. Ciencia e Agrotecnologia, v. 38, n. 4, p. 335–342, 2014.
- MEDEIROS, M. H. F. de et al. Previsão da vida útil de concreto armado de alta resistência com adição de metacaulim e sílica ativa em ambientes marinhos. Rem: Revista Escola de Minas, v. 66, n. 1, p. 59–65, 2013.
- MIRMOGHTADAEI, R. et al. The impact of surface preparation on the bond strength of repaired concrete by metakaolin containing concrete. Construction and Building Materials, v. 80, p. 76–83, 2015.
- NARMATHA, M.; KALA, T. F. Analyse the mechanical properties of metakaolin using as a partial replacement of cement in concrete. International Journal of Civil Engineering, v. 4, n. 1, p. 25–30, 2017.
- NETO, D. D. et al. Probabilidade a séries históricas de precipitação pluvial diária em Piracicaba-SP. Revista Brasileira Agrometeorologica, v. 13, n. 2, p. 273–283, 2005.
- NISZ, C. F.; MARTINENGHI, M.; AGUSTINI, M.; SARAMENTO, T.; SANTOS, S. Viabilidade técnica do uso do pó de pedra para produção de concreto. In: CONGRESSO TÉCNICO CIENTÍFICO DA ENGENHARIA E DA AGRONOMIA, Belém, 2017. Anais [...] Belém, 2017.
- PARANDE, A. K. et al. Study on strength and corrosion performance for steel embedded in metakaolin blended concrete/mortar. Construction and Building Materials, v. 22, n. 3, p. 127–134, 2008.
- RASHWAN, M. M.; MEGAHED, A R.; ESSA, M. S. Effect of local metakaolin on properties of concrete and its sulphuric acid resistance. Journal of Engineering Sciences Assiut University Faculty of Engineering, v. 43, n. 2, p. 183–199, 2015.
- REZENDE, M. L. de S. et al. The effect of metakaolin on the durability of concrete hollow blocks used in masonry: evaluation of degradation caused by driving rain. Rem: Revista Escola de Minas, v. 68, n. 1, p. 21–27, 2015.
- REZENDE, M. L. de S. et al. Uso de metacaulim em concreto seco: uma abordagem por superfície de resposta. Ambiente Construído, Porto Alegre, v. 12, n. 3, p. 135–146, 2012.
- SANTOS, C. C. et al. Interlocking concrete paving blocks produced with foundry sand waste. Materials Science Forum, v. 912, p. 191–195, 2018.
- TUMIDAJSKI, P. J. et al. Comparison of Weibull and normal distributions for concrete compressive strengths. Canadian Journal of Civil Engineering, v. 33, n. 10, p. 1287–1292, 2006.
- VU, C. C.; HO, N. K.; PHAM, T. A. Weibull statistical analysis and experimental investigation of size effects on the compressive strength of concrete-building materials. Case Studies in Construction Materials, v. 17, n. June, p. e01231, 2022.
- VU, C.-C.; HO, N.-K. A comparative study on the probability distribution model for the compressive strength of concrete with consideration of the size effect. Journal of Engineering Research, n. October, 2023.
Edited by
-
Editor:
Marcelo Henrique Farias de Medeiros
Publication Dates
-
Publication in this collection
31 Jan 2025 -
Date of issue
Jan-Dec 2025
History
-
Received
18 Jan 2024 -
Accepted
14 Mar 2024


