Abstract
In recent years, the architectural design process has undergone significant advancements due to computational design, enabling real-time exploration of alternatives through parametric modeling. In the design of buildings, a comprehensive understanding of measurement systems, particularly in the context of natural ventilation, can guide decision-making processes through tests using computational simulations. This paper aims to determine the flow patterns of natural ventilation in indoor environments under five specific conditions using Computational Fluid Dynamics Analysis (CFD) Ansys Fluent® R22. Five configurations are analyzed and compared to a control sample. Adhering to scientific rigor and employing computational techniques, it was possible to achieve satisfactory inferences for indoor airflow. Our findings indicate that the diagonal positioning of openings substantially accelerates wind speed in indoor environments. This design strategy supersedes the need for more openings when the goal is to enhance air speed and indoor air renewal.
Keywords
Natural ventilation; Indoor ventilation; Ansys fluent; Parametric modeling; Simulation-Based Architectural Design
Resumo
Nos últimos anos, o processo de projeto arquitetônico tem experimentado avanços significativos devido ao design computacional, que possibilita a exploração de alternativas em tempo real por meio da modelagem paramétrica. No projeto de edifícios, uma compreensão abrangente dos sistemas de mensuração, especialmente no contexto da ventilação natural, pode orientar os processos de tomada de decisão por meio de testes com simulações computacionais. Este artigo tem como objetivo determinar os padrões de fluxo da ventilação natural em ambientes internos sob cinco condições específicas, utilizando a simulação em Dinâmica de Fluidos Computacional (CFD) no aplicativo Ansys Fluent® R22. Foram analisadas cinco configurações distintas e comparadas com uma amostra controle. Respeitando o rigor científico e empregando técnicas computacionais, foi possível obter inferências satisfatórias para o fluxo de ar em ambientes internos. Os achados indicam que o posicionamento diagonal das aberturas acelera substancialmente a velocidade do vento em ambientes internos. Essa estratégia de projeto substitui a necessidade de mais aberturas quando o objetivo é aumentar a velocidade do ar e a renovação do ar interno.
Palavras-chave
Ventilação natural; Ventilação interna; Ansys Fluent; Modelagem paramétrica; Arquitetura baseada em simulação
Introduction
In environmental simulation processes, the most easily measurable objective variables are those exhibiting recursive behavior, such as the solar trajectory. However, design strategies aimed at promoting comfort combine these variables with others that do not share the same type of behavior, such as radiation or air movement, as indicated by seminal studies on bioclimatic zones by Olgyay and Olgyay (1963) and Givoni (1962, 1998). Since these pioneering works, natural ventilation has emerged as a design alternative for reducing thermal mass in buildings. While there is a consensus among researchers on the benefits of cross ventilation within buildings (CIBSE, 2005; ASHRAE, 2019), explicit epistemology regarding its precise operation remains uncertain. Therefore, an accurate study about positioning of openings is crucial for the design of buildings with consequent effects on ventilation. For instance, parallel windows increase internal ventilation levels, decisions regarding their positioning can result in significant variations in the speed and direction of internal air.
Numerical models of the natural ventilation phenomenon within buildings reveal its complex and chaotic behavior. Many of these insights stem from research on porosity, utilizing CFD and Automotive Ventilation: Heating, Ventilation, and Air Conditioning (HVAC) to ascertain thermal conditions and noise increase (Tan; Yuan, 2022). In architecture, the incorporation of natural ventilation into the design process typically involves consulting climate files. Meanwhile, scientific research in this field progresses with instructional strategies, encompassing wind tunnel testing and CFD simulations with an epistemological bias (Irwin; Denoon; Scott, 2013; Cuce et al., 2019). Recent qualitative studies have drawn conclusions aimed at predicting the effects of cross-ventilation in indoor environments, providing valuable insights for guiding decision-making in architectural design strategies (Zheng et al., 2018).
In recent years, architecture has witnessed significant advancements driven by computer simulation, enabling the exploration of real-time design alternatives through parametric modeling. The integration of these tools with aerodynamic calculations via CFD has facilitated the exploration of building geometry and simultaneous assessment of ventilation effects (Kabošová, 2020; Abbas; Dino, 2019). This includes applications in documentary processes within Building Information Modeling (Poh et al., 2019). While many applications in architectural projects lack native CFD instructions, it is possible to correlate other properties, such as preliminary estimates of thermal performance, with CFD-based ventilation evaluations to mitigate heat gains in buildings (Kwok et al., 2022).
The use of ventilation as a cooling strategy aims for passive solutions without relying on mechanical systems (Obeidat; Kamal; Almalkawi, 2021). CFD simulations have played a crucial role in deriving important conclusions regarding various elements employed in roofs for indoor temperature reduction, ranging from ventilated towers (WEERASURIYAA et al., 2019) and chimneys for ventilation promotion (Li et al., 2022; Laurini et al., 2018) to understanding the aerodynamics of dome geometries (Khosrowjerdi; Sarkardeh; Kioumarsi, 2021) and the impact of balcony depth (Izadyar et al., 2020). Similar simulations have allowed researchers to gauge the influence of architectural elements in either obstructing or enhancing cross-ventilation with more substantial air movement. The placement of walls, for instance, emerges as a crucial factor in enhancing the distribution of internal airflow (Hawendi; Gao, 2017). Similarly, the geometry and positioning of windows play a vital role in enabling wind to penetrate deeper into the internal spaces (Elwan; Dewair, 2019; Yin et al., 2022).
In a similar vein, both numerical and experimental investigations have aimed to delineate natural ventilation within internal environments through the analysis of the building envelope (Lezcano; Burgos, 2021). Design alternatives for office buildings have been proposed based on on-site measurements and numerical models (Kwok et al., 2020; Nasrollahi; Ghobadi, 2022). However, distinctions exist between the understanding of natural ventilation during the design stages and its practical implementation throughout the building’s life cycle (Fu; Han, 2020). Efforts to harness the positive effects of cross-ventilation in school buildings have primarily focused on considerations such as window orientation and the percentage of openings (Elshafei et al., 2017; Subhashini; Thirumaran, 2019; Zhang; Yin; Wang, 2021). Conversely, adverse effects of natural ventilation have been observed in hospital environments (D’Alicandro; Mauro, 2022; Dao; Kim, 2022). Other research has utilized CFD simulations to predict airflow behavior for substance removal (Zhang et al., 2022a), to enhance the well-being of livestock and poultry (Bovo et al., 2022; Küçüktopcu et al., 2022), and to improve the quality of certain crops (Zhang; Kacira, 2022).
CFD validation, aimed at measuring the effects of natural ventilation, has been conducted by comparing results obtained in wind tunnels. This validation ensures an appropriate measurement for different geometric solids, such as a simplified representation of buildings (Lukiantchuki et al., 2020). The focus is on assessing macro effects of ventilation and pollutant dispersion (Cui et al., 2022; Mei; Zeng; Gong, 2022). Various strategies have been proposed to introduce interactions in geometry, evaluating the sensitivity of CFD applications in parametric design (Kumar et al., 2022; Kong et al., 2022; Zhang et al., 2022b; Sakiyama et al., 2021). Additionally, tools have been developed to facilitate rapid manual estimates of heat loss from natural ventilation processes (Donn; Bakshi, 2019). The growing trend of manipulating natural ventilation as a design strategy underscores the increasing need for scientific research to understand more accurately the aerodynamic behavior of internal cross-ventilation (Sakiyama et al., 2020).
In general, ventilation schemes produced by architects during the design process employ cross-sectional drawings to demonstrate the effects of wind inside buildings. However, the impact of the horizontal positions of openings, not depicted in sectional drawings, can be crucial in determining internal ventilation gains. Moreover, there are not enough studies in the literature that have comparatively measured the extent to which horizontal positions influence internal air velocities. As an innovative aspect, this work endeavors to elucidate the behavior of natural ventilation within internal environments under specific conditions. The study employs a numerical design approach comprising five configurations analyzed in comparison to a control sample. These treatments aim to replicate the design strategies associated with cross ventilation, which, in essence, involve the use of parallel openings to induce airflow circulation within the rooms. Inferences about the investigated flow fields were drawn based on these numerical CFD models.
Method
The method procedure consists of simulating different airflow conditions through a low-rise building model. First, geometry and location of entrance and exits are defined, meaning the number of windows that will be kept open and closed to be simulated is settled based on 5 configurations. A base flow is set as a reference operational condition of the external wind. Second, calculation by means of CFD and post-processing steps are repeated for each of the investigated configurations. The results are then considered by inferring about the flow quality (flow pattern inside the building) and some metrics (absolute values) to guarantee a natural flow ventilation inside the model.
Low-rise Building Model
A model was designed, considering possible later comparisons of this numerical simulation with empirical tests in the wind tunnel available in our laboratory, which has a test area of 60 × 60 × 100 mm (Almeida, 2021). In this way, the model represents a real environment of 54 m², measuring 6 × 9 m on a 1:20 scale, with windows and sills of the usual commercial dimensions.
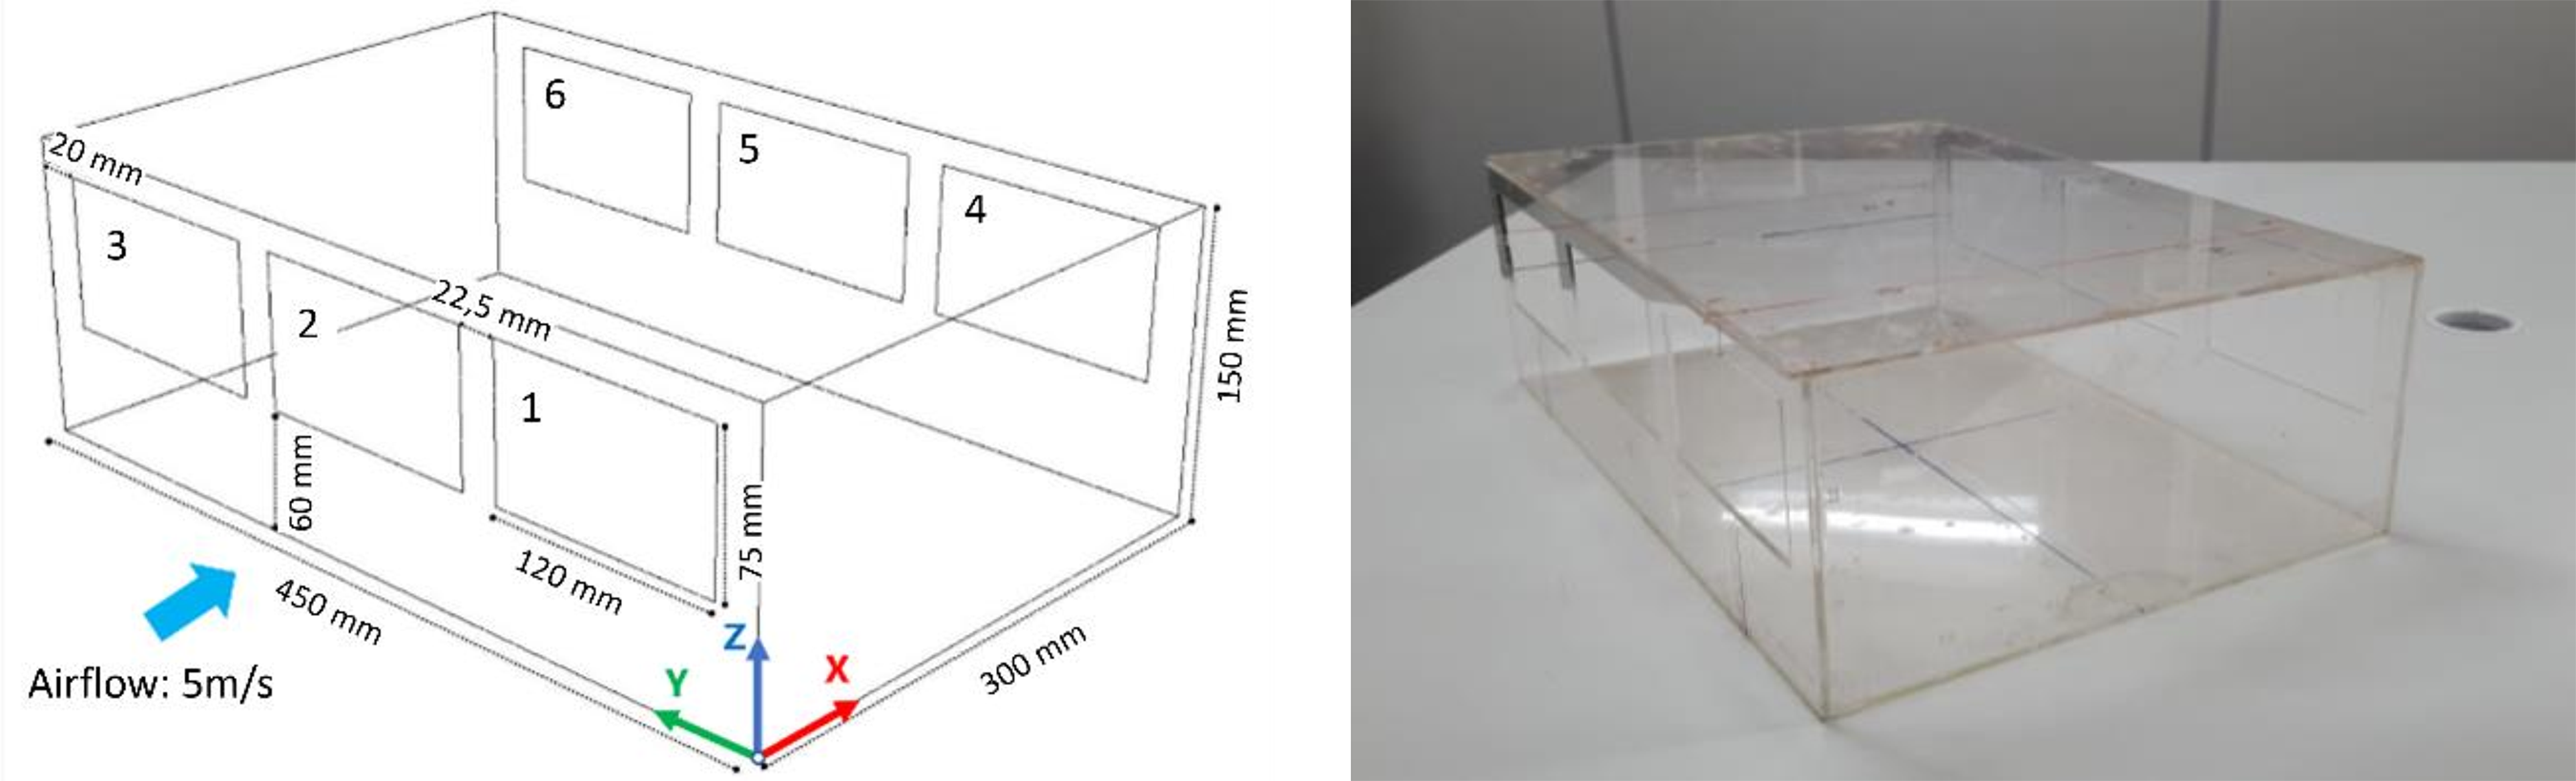
The natural cross-ventilation of a low-rise building was considered to numerically investigate airflow mechanisms and their impact on human life inside a hypothetical sample room. The room, represented by a prototype specifically created for this purpose, has dimensions of 300 × 450 × 150 mm (XYZ), idealized at a scale of 1:20 for similar conditions in wind tunnel tests planned for subsequent stages of this research. The height of the building is now utilized to determine the main descriptive variables for this problem. This rectangular structure features six ventilation windows symmetrically arranged in relation to the model’s axis, with three ventilation openings on the front façade and three ventilation outlets on the back façade. All openings share the same dimensions (w × h = 120 × 75 mm), and the horizontal distance between the openings is 22.5 mm (see Figure 1).
To test the effect on different cross-ventilation patterns, all entrances and exits can be closed independently. Depending on the number and location of the windows, the following cases were considered for analysis (see Table 1).
The basic configuration features only window-type openings, in opposite locations, for analytical purposes. Furthermore, these cut-out openings in the prototype do not fully represent the authentic frames existing in these buildings due to the reductions imposed by simulation and further experimentation.

Characteristics of the prototype of the hypothetical sample room with six openings: dimensions and position of the windows (left); mirroring of the physical prototype for later stages of empirical measurement (right)
Control sample and the five treatments established as a simulation strategy with natural wind simulation set at 5 m/s according to the model validated by Lukiantchuki et al. (2020)
Numerical modeling
The Wind-Driven Natural Cross-Ventilation model configurations (WDN-CV) under a constant airstream of 5 m/s, was simulated using the commercial CFD code Ansys Fluent® R22. The choice of this code was based on the availability of it in the laboratory as a traditional CFD tool that has been used by many other authors in similar works (Cheung; Liu, 2011; Nasrollahi; Ghobadi, 2022). The fundamental assumption for the CFD simulation involves a three-dimensional, fully turbulent, and incompressible flow. Both internal and external flows were modeled using the Realizable k-ε turbulence model - a technique well-established in the field of natural ventilation research, with its limitations and restrictions outlined in several works (Ouyang; Haghighat, 1991; Blocken; Carmeliet; Stathopoulos, 2007). The CFD code adopted the Finite Volume Method (FVM) approach and utilized the Semi-Implicit Method for Pressure-Linked Equations (SIMPLE) for the velocity-pressure coupling. A second-order upwind discretization was used for the advective terms, while second-order central differencing is applied to diffusive terms (viscous terms) as recommended in the literature. While the governing equations will not be reiterated here, they are available in the application manual (ANSYS, 2022).
Computational domain and boundary conditions
A schematic view of the computational domain is presented in Figure 2, the computational domain has dimensions width, height, and length of 0.60 m × 0.60 m × 1.0 m, respectively, based on the height of the building (B = 150 mm). The rationale behind using such domain dimensions is based on the need to reproduce the actual physical assembly in wind tunnel tests, which are being developed in parallel. Despite the inflow distance from the building and the lateral positioning of the model relative to tunnel walls being in proximity, the CFD simulation is reproducing an actual case tested which is a determinant aspect to assure validation.

The inlet boundary condition is assumed as constant velocity with 5 m/s being the flow normal to the entry. At this time, the effect of different incoming flow (incident angle relative to the frontal facade) was not considered. Ambient pressure and temperature were considered as: p∞ = 98,000 Pa, T∞ = 25 °C leading to an air density of 1.18 kg/m3, used in all simulations.
Zero static pressure is applied at the outlet plane, named as outflow, which represents the atmospheric exit of the test-section. For the ground surface, the building model itself and wind tunnel walls (left, right, ground surface and top), the enhanced wall functions were used.
According to the treatment to be tested, as seen in Table 1, at the windows the wall condition was applied making it impermeable to the main flow. The other windows stayed as a hole inside the flow field.
Sizing and mesh approach
Mesh spacing is a fundamental parameter that enables not only accuracy but also reliability in results, contingent upon the proper functioning of the mesh and the computational effort required. To achieve these objectives, five different unstructured meshes sizes were studied following global mesh parameters, as described in Table 2.
The sizing of mesh #4 is illustrated in Figure 3, with detailed refinement visible on the windward wall adjacent to the prototype floor. Notably, the smallest mesh spacing was designated for the near wall (both inside and outside the building) to accurately capture the boundary effect in the flow field. This mesh refinement near the wall adhered to the rules of the RANS approach, maintaining the y+ ratio (the ratio of the distance from the first grid point to the solid edge) between 1 and 30, as depicted in Figure 3. Specifically, for mesh #4 the y+ is around 20 for boundary layer elements.

Multiple cells that are confined inside the fluid constitute a CFD mesh. By combining all these cells and calculating the primary flow parameter values and gradients within them, the entire fluid dynamic field can be numerically solved. The flow characteristics within a cell are approximations, and as a rule, results tend to be more accurate when a finer mesh is employed. Defining a progressively finer mesh near the geometry surface is the most efficient technique to identify the optimum compromise; nevertheless, it is crucial to ensure that the mesh density transition is sufficiently smooth to prevent introducing errors to the solution.
The computer configurations where the simulations were run are: Inter(R) Core (TM) i5-9400F CPU @ 2.90 GHz, which presents 6 cores per socket, 24 Gb of 2666 MHz RAM. All simulations were run in parallel with 6 processors cores. The operating system for the ANSYS Fluent (2022 R1) was Windows 10.
Results and discussion
Validation of the numerical approach
A validation approach was necessary to show the precision, as well as the limitations of the realizable k-ε turbulence model in this study. A set of validation checks were performed namely, grid spacing influence on data (based on Table 2), boundary layer development upstream the model, u-velocity distribution along a horizontal line inside the building and evaluation of u-velocity profile on inlets and outlets to verify the volumetric flow rate (Q = Ag u). Where Ag represents the area of each window in the model. These results are shown in sequence.
Figure 4 illustrates the evolution of the ventilation rate (m³/s) as function of the grid sizing on windows 1 (w1), 2 (w2) and 3 (w3). The discrepancy on the value of this variable between the meshes #4 and #5 was below 1%. Also, the flow field achieved with meshes #4 and #5 were quite similar and the residuals likewise. Based on such results the mesh used for subsequent analysis is that with 2.7 million elements namely mesh #4.

The nondimensional velocity distribution on a horizontal line placed in the height-mid-location of the window 2 to the respective rear window 4 is shown in Figure 5. This result was obtained with mesh #4, as well. In this case, all other windows are opened, which represents the control case. The velocity distribution in the middle of the building is well distributed with the peak value at the entry location as well as the recovery of speed at the exit opening. This explain how well the volumetric flow rate is achieved at the front and rear windows. Since the volumetric flow rate through the inlet and outlet has been almost constant i.e., equal in magnitude, the mass flow is conserved, as expected, despite all eventual recirculating and reverse flow inside the model.

The developed boundary layer is provided in Figure 6 The boundary layer was evaluated at upstream location of 1.23 H starting from 1 mm up to 100 mm into the flow field in the vertical axis. As seen in Figure 6, the numerical velocity profile is quite inflected close to the wall and develops uniformly after a certain height, which is associated to the kind of turbulence modeling used in the present study (k-ε realizable). This trend was observed and discussed previously in the works of Phillips and Soligo (2019) and Blocken, Carmeliet and Stathopoulos (2007) and it is associated to the artificial diffusion in the numerical approach which led the wind flow to slump close to the ground. Another important observation is that the numerical profile is offset to the left (u(z)/Uref < 1), meaning that the mean flow is sensing the presence of the building ahead.

Based on the results obtained in the validation process with mesh#4, it was possible to assume that this mesh setup could be used to simulate all other configurations in this study. The simulations were run and post-processed providing the data shown in sequence.
Face-to-face cross-ventilation
The initial simulation scrutinized pertains to Control: face-to-face cross-ventilation through six openings, wherein the dimensionless velocity distribution was postulated along a horizontal line positioned at the mid-height of window 2 to the corresponding rear window 4. The CFD simulation yielded flow vectors and contours on two horizontal planes, one situated at the midpoint of the windows (intermediate plane) and the other at a layer close to the prototype floor (floor plane). Within the interspace amid the windows, the flow pattern which ingress and egress were examined utilizing the vector field. On the plane beneath the windows, situated near the prototype floor, the simulation illustrates vortices and air flow in the reverse direction to the air inlet. The visually discernible spiral circulation zones depict a phenomenon characterized by reduced air velocities, as seen in the gradient scale (see Figure 7), in the plane beneath the windows. It is imperative to underscore that the Ansys Fluent® R22 simulation response constitutes a static representation encapsulating the average velocities and directions through colors and vectors. Despite disparities in velocity values, ranging from 1.1 to 5 m/s, within the environmental midsection, the peak value at the inlet location is nearly attained, mirroring the recovery of velocity at the outlet opening. This elucidates the effectiveness in achieving the volumetric flow rate at both the front and rear windows, as depicted in the subsequent analyses (see Figure 7).

The outcomes of the CFD simulation, performed using Ansys Fluent® R22, are depicted in Panel (a), representing the plane in proximity to the floor. Meanwhile, Panel (b) portrays the horizontal plane situated at the midpoint of the windows
Face-to-face treatments: T2, T3 and T4
A shared characteristic among these treatments is the manifestation of a form of air flow drag that infiltrates the prototype and subsequently moves counter to the air inlet. Originating from the ingress through the front windows, this flow undergoes compression on the sill of the opposing windows, generating vortices of narrower dimensions compared to those observed in the Control sample, possibly by maintaining parallelism between the windows but with a reduction in air intake. Furthermore, the vortices in the vertical plane exhibit enhanced clarity in contrast to the sample control. Within Treatment 2, parallel air flows are discernible in the intermediate plane, featuring substantial accelerations on the lateral aspects, thereby replicating the symmetry inherent in the open windows. Conversely, on the floor plane, vortices are observable in the opposing direction to the entrance, accompanied by an unforeseen deviation in the central zones and acceleration on the opposing walls. This mirroring behavior is anticipated due to the opposing and symmetrical placement of the open windows, a characteristic not shared by the other treatments within this category. This symmetry or mirroring is notably more precise than observed in the Control sample (refer to Figures 8a and 8b).

The outcomes of the CFD simulation, performed using Ansys Fluent® R22, are depicted in Panels (a), (c), and (e), representing the plane in proximity to the floor. Meanwhile, Panels (b), (d), and (f) portray the horizontal plane situated at the midpoint of the windows
Within T3, designed to emulate the configuration of a funnel, discernible air movement occurs in the central area. In proximity to the sills of windows 4, 5, and 6, the air movement transpires on the posterior side, resulting in diminished velocities in the floor plane when compared to T2. Narrower vortices are observed relative to the Control sample, and there is a more pronounced deposition of stationary air in windows 1 and 3. A comprehensive analysis of both planes reveals that the vortices exhibit a consistent vertical direction, consistently positioned beneath the entrance openings. Regions characterized by minimal activity in the corners of the prototype bear resemblance to the Control sample (refer to Figures 8c and 8d). Moving to T4, which mimics the form of an inverted funnel, the air displacement in the intermediate plane is notably more vigorous along the central aisle. On the floor plane, this movement occurs in the opposite direction to the air entering the prototype. The perceptibility of this movement is more pronounced from the center to the peripheries, accompanied by lower velocities. This observation indicates that the inlet ventilation in this scenario fosters larger vortices originating from the peripheries and converging toward the center of the prototype (see Figures 8e and 8f).
In a comprehensive comparison with the Control sample, the face-to-face treatments exhibit few instances where the inlet and outlet velocities remain constant. Generally, there are discernible and significant losses, at some points, ranging from 5 m/s to close to zero, observed in the lower layers. Furthermore, the regions closest to the floor manifest numerous vortices and a persistent air flow counter to the air inlet, indicative of potential dead zones, likely more pronounced at lower inlet speeds. The observation of more pronounced vortices in the lower layers than in the middle plane clearly indicates zones of air mass deposition. Notably, T2, despite having a smaller inlet area than T3, displays more substantial air velocities even in the lower layers, as seen in the gradient scale (see Figures 8b and 8d), emphasizing the importance of conceptualizing air outlets as a flow corridor when aiming for higher indoor velocities. While T4 demonstrates considerable velocities, around 5m/s in the central corridor, the extremities experience better ventilation in the lower layers.
Diagonal treatments: T1 and T5
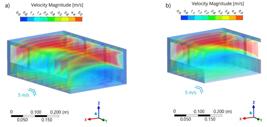
The diagonal treatments exhibited significantly higher velocities, as seen in the gradient scales, and a more extensive distribution of the air layer. In these instances, displacement occurred diagonally, with air layers experiencing substantial acceleration towards the outlet, ranging from 1 to 4 m/s in T1, such as in windows 1 and 6, for example. Vortices were observable in both horizontal and vertical planes, but a detailed analysis of velocities in the intermediate and near-floor planes conveys that these vortices possess diagonal twists, forming a spiral ventilation zone different of vortices formed exclusively in one of the planes. The primary air flows maintain constancy, and at certain points, the observed velocity could surpass the inlet velocity of 5 m/s, which was not measured due to the limits imposed on the experiment. In the planes close to the floor, velocities are also elevated and more uniformly dispersed within the prototype. This dispersion of air particles indicates the presence of twisting vortices, facilitating the detachment of more air from the lower layers. This detached air subsequently reaches the layers closest to the windows and is then “captured” and expelled from the prototype by the high-velocity air flows in these regions.
Despite the significant architectural disparities between T1 and T5, with T5 featuring twice as many windows as T1, the gains of the former over the latter are not as pronounced. While the central regions of the intermediate plane in T5 exhibit higher velocities, the ventilated regions in the lower layers of Treatment 1 manage to be more extensive, even though T5 attains higher velocities at the entrance to the floor plane, as seen in the gradient scales (see Figures 9a and 9c). In both cases, unlike the face-to-face treatments, there are no substantial losses in vortex velocities in the lower layers, indicating that the inlet and outlet velocities remain considerably more constant. Furthermore, in both cases, the experiment revealed similar speeds under all the closed windows of the two tests, ranging from 1 to 2.5 m/s.

The outcomes of the CFD simulation, performed using Ansys Fluent® R22, are depicted in Panels (a), and (c), representing the plane in proximity to the floor. Meanwhile, Panels (b), and (d) portray the horizontal plane situated at the midpoint of the windows
Outcomes interpretation for architectural design
With a focus on causality, we aimed to understand the reasons behind the behavior exhibited by the treatments, starting with a more in-depth investigation of the diagonal treatments, especially treatment T5, which showed significantly higher speeds than the other treatments. Without losing sight of experimental uncertainties, it is essential to note that, unlike empirical wind tunnel tests that use techniques such as smoke to visualize the wind’s behavior instantaneously, CFD simulations are considered an averaged representation. Considering this regular and intermediate behavior, where extreme behaviors are not clearly measured, we sought to analyze the average speeds from cross-sections in the samples, aiming to establish relationships between the airflow in the vertical planes. In the control sample, higher velocities were recorded in the upper part of the room without interfering with the velocities in the lower layers.
In the context of turbulent ventilation in indoor environments produced by the 5 m/s source, face-to-face treatments create sharper velocity differentials in the various layers, resulting in limited mixing. Consequently, they generate pronounced ventilations at the height of the openings without adequately aerating the lower layers, which retain small vortices and dead zones below the sills. While still analyzing the vertical layers of the Control Sample, we can observe an interaction between air particles and the top surface of the model. In this interaction, a portion of the airflow in the central region dissipates outside the model through window 2, while another portion disperses to the sides, exiting through windows 1 and 3. However, it does not contribute to aerating the lower layers (Figures 10a and 10b).
The outcomes of the CFD simulation, performed using Ansys Fluent® R22, are depicted in Panels (a), representing the vertical layers in sample control, with all windows open. Meanwhile, Panels (b) portray the vertical layers focused on the mid-section
As expected in all cases, the layers close to the ground have lower speeds than the intermediate layers, but the diagonal treatments, T1 and T5, have substantially higher speeds than the face-to-face treatments, as seen in the gradient scales. From the point of view of speeds and considering the averages of wind behavior, the differences between T1 and T5 are due to the higher recordings in T5 and a more homogeneous distribution in T1. The higher kinetic energy in these cases can be explained by the behavior of internal ventilation in the layer close to the ground, as opposed to what was observed in the lower layers of the face-to-face treatments. In these horizontal planes, T2, T3, and T4 have speeds of less than 1.7 m/s while promoting much more prominent recirculation zones with a loss of kinetic energy. Velocities in the order of 2.8 to 4.4 m/s comprise more than 70% of the soil layer in both diagonal treatments, and this condition is directly related to the aeration promoted at the height of the windows.
This relationship between ground speeds and the aeration of the internal environment is best understood by examining the vertical ventilation planes of the diagonal treatments. The major contribution to the substantial increase in speed is related to the air particles’ ability to suspend themselves, allowing them to rise in the airflow between windows and disperse outside the room. When looking at the T5 vertical vortices, we observe much more significant mixing of ventilation flows between the middle layer and the layer close to the ground than in the face-to-face treatments. This type of behavior forms a less drastic gradient of velocities between the layers, and although this division of layers is merely an analytical artifice, it is precisely the analysis of these two layers that will enable the designer to understand them when making design decisions. Air vortices in the vertical plane have a positive effect, as opposed to horizontal vortices, which generally stabilize air masses and act negatively when attempting to increase internal wind speeds (Figures 11a and 11b).

The outcomes of the CFD simulation, performed using Ansys Fluent® R22, are depicted in Panel (a), representing the horizontal vortices in T5, and Panel (b), representing the vertical vortices in T5
In summary, the strategies for promoting cross-ventilation in internal environments are just as crucial as the size and arrangement of windows within the room. The outcomes demonstrated that the design decision-making process should be influenced by the combination of window size and position. In dimensions and speeds like the study carried out here, the ventilation phenomenon should consider diagonal treatments as potential speed accelerators, not only focusing on windows but any opening that can be controlled by the user. However, it should be noted that these variables serve as guidelines for designers’ decision-making, and increasing the height of windows will significantly enhance the internal wind speeds, as well as influence the behavior condition, whether turbulent or lamellar.
The role of aerodynamic calculation in architectural decision-making is not new and has been substantially enhanced since the 2003 project for The Swiss Tower, designed by Foster and Partners in London (Wolfram, 2023). Considering contemporary design processes like this, our contribution remains focused on first-floor buildings with a depth of 5 to 10 meters and parallel openings. However, the use of ventilation tests, whether numerical or empirical experimentation, does not obviate the need for a precise and reliable determination of the phenomenon of cross-ventilation. The significant increase in ventilation resulting from the rise in building height must be considered, in the order of 20 m/s at the top of 25 floors under average conditions (Irwin; Denoon; Scott, 2013). Therefore, it can be said that the most suitable strategies for controlling ventilation would be to avoid diagonal window arrangements. However, it cannot be asserted that the conditions presented in the model proposed here would behave proportionally with higher speeds. According to Veloso Filho and Sousa (2023), promoting and controlling ventilation through openings is considered the most promising alternative for enhancing energy efficiency in buildings.
Conclusions
The computer simulation represents an average of the movements in discrete planes, akin to a photograph of the average behavior of the ventilation in constant flows. With respect to these scientific reductions and an analysis of the five conditions in a complementary manner, we concluded that the diagonal positioning of the openings substantially accelerates the wind speed in indoor environments, making this design strategy more effective than simply adding more openings when the intention is to increase the speed and renewal of indoor air. To illustrate, consider air particles akin to people in a crowd seeking entry into an indoor environment. If there are numerous entry points, the crowd moves at a slower pace. Conversely, a smaller number of diagonally positioned openings creates a longer, narrower path, facilitating greater acceleration and, consequently, higher speeds.
One of the most debated topics today revolves around the quality of air within buildings, particularly concerning the health and comfort of their occupants. Considering this and other scientific findings, understanding and controlling ventilation through openings can profoundly impact the air quality breathed by individuals – especially considering that many people spend several hours indoors with limited air exchange. Aspects such as filtering pollutants, ensuring thermal comfort, promoting overall well-being, and controlling respiratory diseases have become crucial considerations in architectural design. In this context, the adoption of measures capable of enhancing indoor air quality and renewal, such as strategic positioning of openings, can represent pivotal decisions. These decisions not only contribute to overall health and comfort but also play a crucial role in preventing the spread of airborne viruses like SARS-CoV-2. By mitigating harmful effects, such measures positively influence both individual health and overall productive capacity.
Acknowledgments
This work has been supported by the following Brazilian research agencies: Minas Gerais Research Foundation (FAPEMIG: Grant # APQ01926-17) and the National Council for Scientific and Technological Development (CNPq).
-
BITTAR, M.; ARAUJO, A. L. de; ALMEIDA, O. de; MARTINS, T.; SOUSA, M. Enhancing indoor airflow: insights on cross ventilation through CFD simulations. Ambiente Construído, Porto Alegre, v. 25, e137844, jan./dez. 2025.
References
- ABBAS, G.; DINO, İ. A parametric design method for CFD-supported wind-driven ventilation. IOP Conference Series: Materials Science and Engineering, v. 609, p. 1-7, 2019.
- ALMEIDA, O. The development of an experimental aerodynamics research center in Brazil, International Journal of Advanced Engineering Research and Science v. 8 n. 3, 2021.
- AMERICAN SOCIETY OF HEATING, REFRIGERATING AND AIR-CONDITIONING ENGINEERS. ANSI/ASHRAE Standard 62.1-2019: ventilation for acceptable indoor air quality. Peachtree Corners, 2019.
- ANSYS. Ansys fluent theory guide Canonsburg: Ansys Incorporation, 2022.
- BOVO, M. et al Assessment of geometrical and seasonal effects on the natural ventilation of a pig barn using CFD simulations. Computers and Electronics in Agriculture, v. 193, p. 1-17, 2022.
- BLOCKEN, B.; CARMELIET, J.; Stathopoulos, T. CFD evaluation of wind speed conditions in passages between parallel buildings: effect of wall-function roughness modifications for the atmospheric boundary layer flow. Journal of Wind Engineering and Industrial Aerodynamics, v. 95, p. 941-962, 2007.
- Chartered Institution of Building Services Engineers. CIBSE: natural ventilation in non-domestic buildings. London, 2005.
- CHEUNG, J.; LIU, C. CFD simulations of natural ventilation behaviour in high-rise buildings in regular and staggered arrangements at various spacings. Energy and Buildings, v. 43, n. 5, p. 1149-1158, 2011.
- CUCE, E. et al Sustainable ventilation strategies in buildings: CFD research, Sustainable Energy Technologies, and Assessments v. 36, p. 1-10, 2019.
- CUI, P. et al Numerical studies on issues of Re-independence for indoor airflow and pollutant dispersion within an isolated building. Building Simulation, v. 15, p. 1259-1276, 2022.
- D’ALICANDRO, A.; MAURO, A. Effects of operating room layout and ventilation system on ultrafine particle transport and deposition. Atmospheric Environment, v. 270, p. 1-15, 2022.
- DAO, H.; KIM, K. Behavior of cough droplets emitted from Covid-19 patient in hospital isolation room with different ventilation configurations. Building and Environment, v. 209, p. 1-11, 2022.
- DONN, M. R.; BAKSHI, N. A natural ventilation “calculator”: the challenge of defining a representative ‘performance sketch’ in practice and research. Materials Science and Engineering, v. 609, p. 1-7, 2019.
- ELSHAFEI, G. et al Numerical and experimental investigations of the impacts of window parameters on indoor natural ventilation in a residential building. Energy and Buildings, v. 141, p. 321-332, 2017.
- ELWAN, M.; DEWAIR, H. Lattice windows as a natural ventilation strategy in hot, humid regions. Simulation for a Sustainable Built Environment, v. 397, p, 1-15, 2019.
- FU, X.; HAN, M. Analysis of natural ventilation performance gap between design stage and actual operation of office buildings. Web of Conferences, v. 172, p. 1-6, 2020.
- GIVONI, B. Basic Study of ventilation problems in housing in hot countries Haifa: Building Research Station, Technion, Israel Institute of Technology, 1962.
- GIVONI, B. Climate considerations in building and urban design London: John Wiley & Sons, 1998.
- HAWENDI, S.; GAO, S. Impact of an external boundary wall on indoor flow field and natural cross-ventilation in an isolated family house using numerical simulations. Journal of Building Engineering, v.10, p. 109-123, 2017.
- IRWIN, P.; DENOON, R.; SCOTT, D. Wind tunnel testing of high-rise buildings London: Routledge, 2013.
- IZADYAR, N. et al Numerical simulation of single-sided natural ventilation: Impacts of balconies opening and depth scale on indoor environment. IOP Conference Series: Earth and Environmental Science, v. 463, p. 1-6, 2020.
- KABOŠOVÁ, L. Analysis of wind-adaptive architecture. IOP Conference Series: Materials Science and Engineering, v. 867, p. 1-8, 2020.
- KHOSROWJERDI, S.; SARKARDEH, H.; KIOURMARSI, M. Effect of wind load on different heritage dome buildings. European Physical Journal Plus, v. 136 p. 1-18, 2021.
- KONG, X. et al Comparison study of thermal comfort and energy saving under eight different ventilation modes for space heating. Building Simulation, v. 15, p. 1323-1337, 2022.
- KÜÇÜKTOPCU, E. et al Computational Fluid Dynamics modeling of a broiler house microclimate in summer and winter. Animals, v. 12, p .1-16, 2022.
- KUMAR, N. et al Parametric study on vertical void configurations for improving ventilation performance in the mid-rise apartment building. Building and Environment, v. 215, p. 1-16, 2022.
- KWOK, H. et al Impact of shaft design to thermal comfort and indoor air quality of floors using BIM technology. Journal of Building Engineering, v. 51, p. 1-19, 2022.
- KWOK, H. et al Multi-zone indoor CFD under limited information: An approach coupling solar analysis and BIM for improved accuracy. Journal of Cleaner Production, v. 244, p. 1-14, 2020.
- LAURINI, E. et al Passive Ventilation for Indoor Comfort: a comparison of results from monitoring and simulation for a historical building in a temperate climate. Sustainability, v. 10, p. 1-20, 2018.
- LEZCANO, R; BURGOS, M. Airflow analysis of the Haida plank house, a breathing envelope. Energies, v. 14, p. 1-14, 2021.
- LI, W. et al CFD simulation of wind and thermal-induced ventilation flow of a roof cavity. Building Simulation, v. 15, p. 1611-1627, 2022.
- LUKIANTCHUKI, M. A. et al Wind tunnel and CFD analysis of wind-induced natural ventilation in sheds roof building: impact of alignment and distance between sheds. International Journal of Ventilation, v. 19, p. 141-162, 2020.
- MEI, X.; ZENG, C.; GONG G. Predicting indoor particle dispersion under dynamic ventilation modes with high-order Markov chain model. Building Simulation, v. 15, p. 1243-1258, 2022.
- NASROLLAHI, N.; GHOBADI, P. Field measurement and numerical investigation of natural cross-ventilation in high-rise buildings: thermal comfort analysis. Applied Thermal Engineering, v. 211, p. 1-25, 2022.
- OBEIDAT, B.; KAMAL, H.; ALMALKAWI, A. CFD Analysis of an innovative wind tower design with wind-inducing natural ventilation technique for arid climatic conditions. Journal of Ecological Engineering, v. 22, p. 86-97, 2021.
- OLGYAY, V.; OLGYAY, A. Design with climate: bioclimatic approach to architectural regionalism. Princeton: University Press, New Jersey, 1963.
- OUYANG, K.; HAGHIGHAT, F. A procedure for calculating thermal response factors of multi-layered walls-state space method. Building and Environment, v. 26, n. 2, p. 173–177, 1991.
- PHILLIPS, D. A.; SOLIGO, M. J. Will CFD ever replace wind tunnels for building wind simulations? International Journal of High-Rise Buildings, v. 8 n. 2, p. 107-116, 2019.
- POH, H. J. et al Airflow modelling software development for natural ventilation design: green building environment simulation technology. Earth and Environmental Science, v. 238, p. 1-7, 2019.
- SAKIYAMA, N. R. M. et al Using CFD to evaluate natural ventilation through a 3D parametric modeling approach. Energies, v.14, p. 1-27, 2021.
- SAKIYAMA, N.R.M. et al Perspectives of naturally ventilated buildings: a review. Renewable and Sustainable Energy Reviews, v. 130, p. 1-18, 2020.
- SUBHASINI, S.; THIRUMARAN, K. CFD simulations for examining natural ventilation in the learning spaces of an educational building with courtyards in Madurai. Building Services Engineering Research and Technology, v. 41, p. 466 – 479, 2019.
- TAN, L.; YUAN, Y. Computational fluid dynamics simulation and performance optimization of an electrical vehicle Air-conditioning system. Alexandria Engineering Journal, Alexandria, v. 61, p. 315-328, 2022.
- VELOSO FILHO, A.; SOUZA, R. The potential of mixed-mode ventilation in office buildings in mild temperate climates: an energy benchmarking analysis. Energy and Buildings, v. 297, p. 1-11, 2023.
- WEERASURIYAA, U. et al A holistic framework to utilize natural ventilation to optimize energy performance of residential high-rise buildings. Building and Environment, v. 153 p 218 – 232, 2019.
-
WOLFRAM, S. Twisted architecture in London. Available: https://blog.wolfram.com/2009/09/11/twisted-architecture Access: 08 dec. 2023.
» https://blog.wolfram.com/2009/09/11/twisted-architecture - YIN, H. et al Airflow pattern and performance of attached ventilation for two types of tiny spaces. Building Simulation, v. 15, p. 1491-1506, 2022.
- ZHANG, T. et al Study on the kinetic characteristics of indoor air pollutants removal by ventilation. Building and Environment, v. 207, p. 1-8, 2022a.
- ZHANG, X. et al Cross-ventilation of a generic building with various configurations of external and internal openings. Building and Environment, v. 207, p. 1-18, 2022b.
- ZHANG, Y.; KACIRA, M. Analysis of climate uniformity in indoor plant factory system with computational fluid dynamics (CFD). Biosystems Engineering, v. 220, p.73-86, 2022.
- ZHANG, Z.; YIN, W.; WANG, T.; O’D. A. Effect of cross-ventilation channel in classrooms with interior corridor estimated by computational fluid dynamics. Indoor and Built Environment, v. 12, p. 1-19, 2021.
- ZHENG, X. et al Natural Ventilation, Handbook of Energy Systems in Green Buildings. p. 1227-1270, 2018.
Edited by
-
Editor:
Enedir Ghisi
-
Editora de seção:
Kelen Dornesles
Publication Dates
-
Publication in this collection
31 Jan 2025 -
Date of issue
Jan-Dec 2025
History
-
Received
04 Jan 2024 -
Accepted
07 Apr 2024