Abstract
Unmanned Aerial Systems (UAS) are frequently used to inspect building envelopes. Computer vision technologies and Convolutional Neural Networks (CNN) have emerged as promising solutions for automating image-based inspections. However, some anomalies still occur during construction due to the lack of an efficient Quality Management System (QMS). To address this gap, this study proposes an automated CNN-based recognition model to detect and classify four types of anomalies in cast-in-place concrete facades during construction, aiming to support decision-making within the QMS. The research strategy adopted was a Case Study, in which eight CNN models were developed for training and testing using images of cast-in-place concrete wall facades collected by UASs during construction. The model achieved 51.80% precision, 68.50% recall, 65.00% mAP, and an F1-score of 58.99% during training, making it the most accurate among the eight models. Future studies will focus on fully integrating the proposed method’s workflow, enabling automated image analysis and the automatic generation of reports.
Keywords
Construction management; Digital Technology; Cast-in-place concrete wall facades; Drones; Machine Learning (ML)
Resumo
Os drones são frequentemente usados para inspecionar envelopes de edifícios. Tecnologias de visão computacional e Redes Neurais Convolucionais (CNN) surgiram como soluções promissoras para automatizar a inspeção baseada em imagens. No entanto, algumas anomalias ainda ocorrem durante a construção da edificação devido à falta de um Sistema de Gestão da Qualidade (SGQ) eficiente. Para abordar essa lacuna, este estudo propõe um modelo de reconhecimento automatizado baseado em CNN para detectar e classificar quatro tipos de anomalias em fachadas de concreto moldado no local durante a construção, visando apoiar a tomada de decisão no SGQ. A estratégia de pesquisa adotada foi o Estudo de Caso, no qual oito modelos de CNN foram desenvolvidos para treinamento e teste com imagens coletadas por UASs durante a construção. O modelo atingiu 51,80% de precisão, 68,50% de recall, 65,00% de mAP e uma pontuação F1 de 58,99% durante o treinamento, tornando-se o mais preciso entre os oito. Estudos futuros se concentrarão na integração total do fluxo de trabalho do método proposto, permitindo a análise automatizada e a geração automática de relatórios.
Palavras-chave
Gestão das construções; Tecnologias digitais; Fachadas de paredes de concreto moldadas no local; Drones; Aprendizado de Máquina (AM)
Introduction
Inspecting buildings during construction involves assessing whether the execution of building components meets applicable regulations, standards, contractual obligations, and design specifications from the beginning of the construction phase until its completion (Silva, 2023). The inspection aims to verify the project’s status and determine if elements are approved, rejected, or need modification (Ochoa et al., 2011). Inspections during construction are necessary to assess key structural and safety issues, ensuring resilient buildings that protect residents’ safety and health and facilitate cost-effective maintenance (Tekin, 2022).
However, quality inspection in the construction engineering field traditionally requires qualified inspectors to use traditional tools to manually inspect each standard requirement and record the information in a document or enter it into a computer system for storage at the end of the inspection (Yuan et al., 2021). The main limitations in inspecting the facade are its size, the building height, and inadequate safety conditions for identifying damage (Saleem; Mayne; Napolitano, 2023). Thus, manual inspection is slow, demanding, costly, and limited in objectivity and reliability (Cusumano et al., 2024). To address these issues, digital technologies like Unmanned Aerial Systems (UAS) and Artificial Intelligence (AI) have been investigated to assist decision-making and automate the process, making it faster, safer, and more reliable (Li et al., 2022).
Recent studies have focused on the application of AI and its subsets, such as Machine Learning (ML), Deep Learning (DL), and Convolutional Neural Networks (CNN) for crack detection (Ruiz et al., 2020; Ko; Prieto; Soto, 2023; Katsigiannis et al., 2023; Mathur; Sharma; Azeemuddin, 2024). Other studies have also used algorithms to identify exposed reinforcement (Rubio et al., 2019; Santos et al., 2022) and structure corrosion (Munawar et al., 2022; Lemos et al., 2023).
In this paper, anomalies refer to irregularities, abnormalities, or exceptions that reduce building performance, stemming from design, construction, end-of-service life, or external factors, according to NBR 16747 (Associação Brasileira de Normas Técnicas) (ABNT, 2020). In general, the results of these researchers were promising for detecting such anomalies. However, in many cases, the inspected structure does not present just one type of anomaly, requiring studies to detect and classify more than one anomaly to assist engineers and managers in treating them during construction. The results were promising for detecting anomalies, but structures often have multiple types, requiring further studies to support engineers and managers in classifying and addressing them.
Moreover, this research analyzed specific studies on automated inspections of building facades. Most of the studies identified in the literature were developed during the buildings’ Operation & Maintenance (O&M) phase, thus requiring studies on the automation of inspections during the execution phase. Furthermore, Ma, Liu and Li (2023) emphasize that information generated from automated methods must be implemented during the execution process, supporting the Quality Management Systems (QMS). Notable studies were identified focus on automated inspections of pinched facades (Chen et al., 2023), facades with ceramic coatings (Kung et al., 2021; Sousa; Sousa; Maués, 2022; Wang et al., 2024), and mortared facades (Valero et al., 2019). Despite the efficiency obtained by these Machine Learning-based studies, most facades are composed of materials with characteristics that stand out from anomalies. This helps train the algorithm to detect or classify objects.
Facade images collected by UAS include elements like windows, sills, and balconies. Cast-in-place concrete facades add challenges, as marks left during construction can confuse algorithms when identifying anomalies. Although subtle, the defects in this type of facade are significant. The concrete segregation and exposed reinforcement can easily be confused with details on the facades. Still, they represent enormous damage to the building’s structure, considering that this concrete wall system also acts as a structural system. Therefore, methods using technologies such as UAS and Artificial Intelligence, specifically CNN, must be developed to identify facade anomalies and generate information to support decision-makers in correcting defects in a timely fashion during the construction process.
This study proposes an automated model based on CNN to detect and classify four types of anomalies in cast-in-place concrete facades during construction to speed up decision-making in the QMS. This paper significantly contributes by applying digital technologies during construction, unlike most studies on the O&M phase. To the best of the authors’ knowledge, this is the first study to employ UAS and AI for QMS in cast-in-place concrete systems, filling a gap in the existing literature. Nevertheless, this study also offers collected images from construction sites during inspections, and the developed algorithm addresses four labels, surpassing most studies that focus on just one.
Background
Artificial Intelligence (AI) emerged in the 1940s and focused on creating machines or programs that mimic human intelligence. Recent advances in AI, particularly in Machine Learning (ML) and Deep Learning (DL), have driven progress in areas such as computer vision, robotics, and speech recognition (Müller; Guido, 2016; Baduge et al., 2022). DL, especially through Convolutional Neural Networks (CNNs), excels in tasks like image recognition and translation due to increased computing power. Computer Vision (CV) enables computers to interpret digital images or videos, mimicking human vision (LeCun; Bengio; Hinton, 2015). Relevant research in the construction industry has applied these algorithms alongside CV techniques to detect and classify anomalies in building facades. Table 1 summarizes the key studies, highlighting the type of AI algorithm used, the facade typology, the anomalies analyzed, and the accuracy achieved by the proposed models.
Based on the analysis of the studies presented in Table 1, significant advancements in using neural networks and computer vision for detecting and classifying anomalies in facades are evident. Kung et al. (2021) studied the detection and classification of building pathologies using a pre-trained CNN VGG-16 classifier, focusing on efflorescence, spalling, cracking, and defacement in ceramic facades. Similar studies have automatically analyzed images of ceramic facades to detect delamination, spalling, and tile loss (Sousa; Sousa; Maués, 2022; Wei et al., 2023). Sousa, Sousa and Maués (2022) used algorithms from the You Only Look Once (YOLOv2) architecture, a real-time object detection system, achieving excellent Key Performance Indicators (KPIs). In contrast, Wei et al. (2023) used a more recent version of this architecture, YOLOv7, but the indicators were not as high. Chen et al. (2021) included ceramic facades and plastered and painted facades, aiming to detect and classify six different anomalies using the U-Net architecture, a CNN designed for biomedical image segmentation, and achieving high KPIs, as shown in Table 1.
Another relevant study by Guo et al. (2020) tested various architectures to classify anomalies in plastered and painted facades, achieving good results. Additionally, Katsigiannis et al. (2023) and Mathur, Sharma and Azeemuddin (2024) employed different architectures to detect cracks in brick masonry and natural stone facades, respectively, achieving excellent performance in their analyses.
The existing literature reveals the development of various image-based methods designed to facilitate facade defect inspections. Several strategies have been proposed to streamline data acquisition and ensure the safety of inspectors by using UASs equipped with cameras to capture images (Silva; Costa, 2022). Additionally, subfields of AI have been widely employed to analyze the data, aiming to eliminate inspector subjectivity (Silva et al., 2023). However, despite the significance of these efforts, some knowledge gaps remain to be addressed regarding automated facade inspections.
The first gap relates to the types of facades investigated in the literature. Most studies develop their methods for facades with ceramic tiles (Kung et al., 2021; Sousa; Sousa; Maués, 2022), plastered and painted facades (Guo et al., 2020; Wei et al., 2023; Wang et al., 2024), brick masonry facades (Katsigiannis et al., 2023), and natural stone facades (Mathur; Sharma; Azeemuddin, 2024; D’Orazio et al., 2024). Although these studies have significantly contributed to the knowledge of facade inspection, no research involving automated inspection of cast-in-place concrete facades was found in the literature. Furthermore, given the increasing use of this construction system, especially in Latin America, there is a clear need for studies addressing this typology.
Furthermore, the main gap identified is the need for studies on automated facade inspections during the construction phase of buildings. Although there is a growing need for inspections at this stage, as highlighted by Tekin (2022), few studies apply digital technologies to improve these processes, especially within the Quality Management System (QMS), as noted by Nwaogu et al. (2023). QMS activities are still performed manually and on paper, making the process slow and prone to errors, according to Yuan et al. (2021). This emphasizes the need to adopt UASs and AI algorithms for image analysis to support QMS during construction. Moreover, despite recent advancements, none of the reviewed studies have incorporated the data obtained into management processes. Nwaogu et al. (2023) also underscore the importance of further research into using UASs and AI to overcome the challenges of facade inspections and support decision-making during construction.
While numerous image-based automated inspection methods exist for defect identification, few integrate real-time data into management processes to support decision-making. The literature needs methods that use UAS to capture images of cast-in-place concrete facades, analyze them with ML algorithms, and incorporate the results into management workflows.
Research method
The research strategy adopted was the Case Study, an empirical research approach that investigates a contemporary phenomenon within its real-world context, involving qualitative and quantitative analyses (Yin, 2015). Therefore, this research explores the use of CNN algorithms for the automated analysis of images collected by UAS, aiming at the automated recognition of anomalies in concrete wall facades during construction in support of the Quality Management System. This study was developed in the following steps (Figure 1):
-
definition of the research scope;
-
definition of the digital technologies used;
-
acquisition of images with UASs;
-
database creation and development of automated recognition models;
-
model training and testing; and
-
evaluation of results through performance indicators.

Research scope
The research was conducted in buildings developed by a company called Company X, located in the metropolitan region of Salvador-Bahia. The company develops and builds primary projects with similar characteristics for the medium- and low-income housing segment. The project involves vertical towers and uses a construction system of cast-in-place concrete walls. This method uses formworks, usually steel or aluminum, to shape the fronts’ desired form. Workers place steel reinforcements and tubing (electrical and hydraulic) within these formworks, then pour concrete inside them. Workers use metallic components like brackets, faquettes or wedges, pins, and span extenders to connect the forms intended for concrete. The QMS professionals monitor all processes, including the assembly and disassembly of the concrete molds.
The data used in this study were collected during the execution of three projects developed by this company. Project 1 has a construction area of 17,757.07 m², with 160 units in two ten-story buildings and eight apartments per floor. Project 2 covers 15,121.54 m² and includes 320 units in four ten-story buildings and eight apartments per floor. Project 3 spans 18,585.53 m², comprising 360 units in three fifteen-story buildings and eight apartments per floor. Both projects use a foundation slab foundation and a cast-in-place concrete wall structure.
These works were selected from a meeting with managers from Company X in which eleven problems found in concrete wall facades were raised, including:
-
exposed reinforcement;
-
fissure;
-
failure to remove knives;
-
failure to caulk the frames;
-
cold joint;
-
alignment between floors;
-
ripples;
-
failure to apply the texture and final painting;
-
humidity and infiltration;
-
concreting nests; and
-
stains and changes in the tone of the facade.
Based on this survey, eleven defects previously selected were investigated and analyzed to determine if they could be identified using UAS and machine learning algorithms. Given this, the scope of the research was narrowed down to four constructive defects:
-
exposed reinforcement;
-
failure to remove the slats that lock the metal forms during the concreting of the structure;
-
concrete segregation; and
-
cracks (Figure 2).

This scope was reduced due to the characteristics of the defects, as some of them could not be seen by images collected with UAS and machine learning.
Digital technologies used
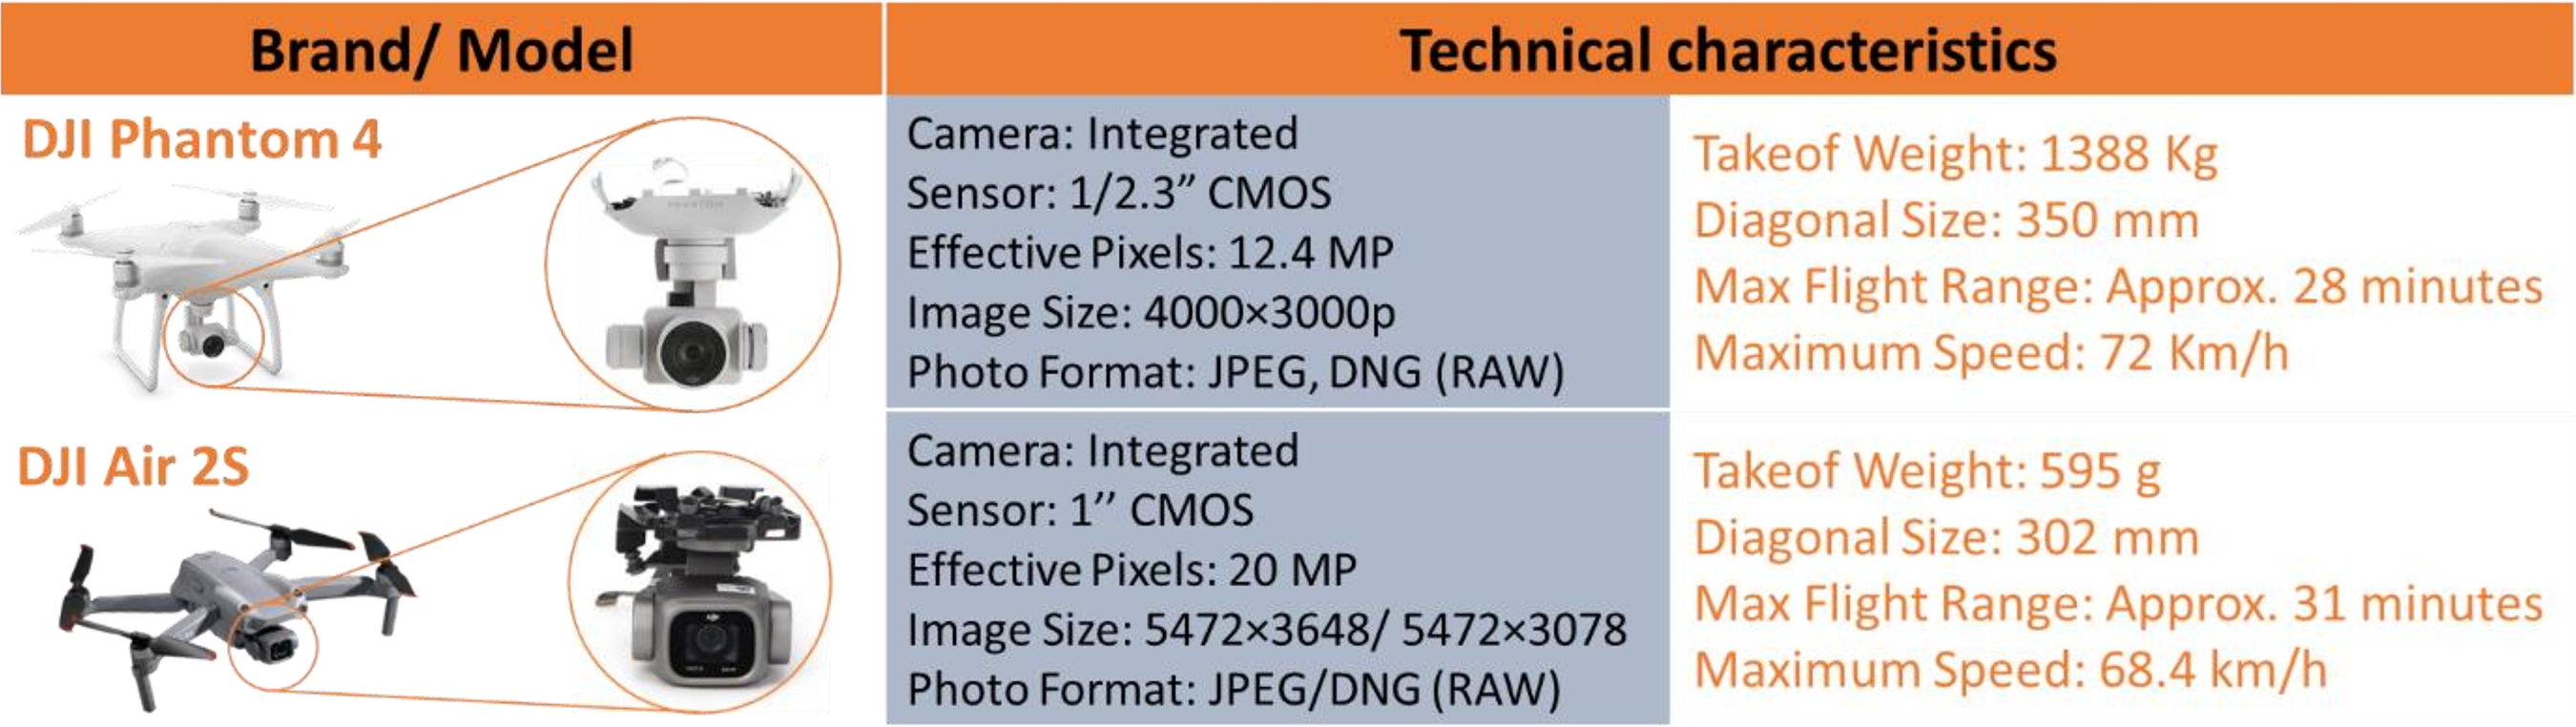
This work used two quadcopter-type UAS for image acquisition (Figure 3). These aircraft are easily operated and broadly used on construction sites due to their vertical landing, takeoff, and high-resolution image collection.

The images collected with UAS were processed using Azure Cognitive Services software Microsoft Custom Vision. This cloud-based Application Programming Interface (API) software enables rapid building and prototyping of image classifications, using CNN algorithms to label image sets and train models. The Microsoft Custom Vision algorithm trains images using pre-trained networks ResNet and AlexNet. Thus, the model results were evaluated through performance analysis during training and testing.
Acquisition of images with UASs
This phase was based on a protocol to standardize the data collection process and improve efficiency. The protocol for anomaly image acquisition on cast-in-place concrete wall facades using UAS consists of four steps. First, preliminary analysis evaluates the inspection location and flight permissions at that location. Then, the UAS is assembled following a flight checklist used by Melo et al. (2017). The third stage involves developing the flight path, considering obstacles and areas of interest. In the fourth stage, two flights per L-shaped building are recommended to capture images of the four facades where the UAS remains approximately 4.5 meters from the building (Figure 4a).

(a) Position of operators during the Flight; and (b) Flight trajectory performed on the four facades
Thus, the UAS begins its trajectory on the top floor of the building and travels from one end to the other, capturing images every two floors at a time, covering approximately 6 meters (two floors), capturing images every two meters, with the angle of the camera at 0º (Figure 4b). Finally, the UAS is disassembled, and the images are transferred to a notebook or cloud. Factors such as solar position and winds are considered during the flight, as they can affect the quality of the images collected. The entire route of the UAS was carried out manually, where the pilot prepared a flight plan before the inspection and carefully executed it during the inspection, seeking to scan the entire building.
In Project 1, four site visits were conducted. The first, on March 17, 2022, aimed to understand the site dynamics and map management processes, while the subsequent three visits (from March 21 to April 29, 2022) focused on image acquisition with a UAS and monitoring the construction process and QMS. These images were then analyzed based on the four anomalies defined in the previous phase. Similarly, Project 2 involved ten visits from June 2022 to January 2023, collecting data on:
-
quality requirements for concrete wall execution;
-
UAS images of facades;
-
feedback on inspection reports with the production team; and
Project 3 followed a comparable data collection protocol, with five visits, as outlined in Table 2.
Database and creation of automated recognition models
After image acquisition, only those containing anomalies were selected for model creation. In total, nine models were developed in Microsoft Custom Vision. The database was composed of images collected on-site, images provided by a diagnostic engineering professional, and the application of Data Augmentation (DA) techniques to expand the dataset. Thus, two models were created with original photos, referred to as Original Models (MO); four models were developed to evaluate each anomaly individually, referred to as Individual Models (MI), and two models using DA (MDA).
The Data Augmentation technique expanded the database since the images with defects in the dataset were considered insufficient for training the algorithms. The DA technique enables the creation of organic images from natural ones (Staffa et al., 2023). Thus, five images were created from an original image, including modifications such as rotation of 90º, 180º, 270º, and vertical and horizontal inversion, as shown in Figure 5. This process was automated using Python language code, which allowed the automatic multiplication of the existing database.

The number of images used in each model is presented in Table 3. It is worth mentioning that the photos were collected in different buildings with concrete wall facades. However, the study’s objective was to evaluate which model presents the best indicators regardless of the photo of the building. After training the models, tests were carried out to evaluate the percentage of automated recognition for each model using ten images for each tag, which was different from those used for training. It is important to highlight that a 70/30% division was not used, for example, for training and testing. The reason for using ten images is the small database of this study, although some studies identified in the literature adopt 10% of the database for testing (Chen et al., 2021; Mathur; Sharma; Azeemuddin, 2024).
Furthermore, according to the Microsoft Custom Vision® documentation, the API uses pre-trained networks based on the ResNet and AlexNet architectures, which are trained to focus on the distinguishing features observed in the datasets and classes provided by the user (Liakhovich; Mbemba, 2017). Table 4 presents the details of the architectures used in this research through the Microsoft Custom Vision® API. However, it is impossible to control which architecture the API uses, and it is unclear whether it uses both in all models. Therefore, this definition was based on the original papers of AlexNet (Krizhevsky; Sutskever; Hinton, 2012) and ResNet (He et al., 2015).
On the other hand, it is possible to control the following Hyperparameters in the API, such as (H01) Training time, (H02) Probability Threshold, and (H03) Overlap Threshold, according to the values presented in Table 3.
Training time refers to the time required for the model to learn from the provided images and data. Since Microsoft Custom Vision is a cloud-based API, it does not require local computational resources and does not allow training models until convergence or implementing early stopping (Microsoft, 2024). Therefore, the training time was based on previous studies, such as those by Staffa et al. (2023), which used 4 hours of training. The Probability Threshold adjusts the confidence level required for a prediction to be correct. Higher values increase precision but reduce recall, resulting in fewer detections. Conversely, lower values improve recall but lead to more false positives (Microsoft, 2024). Based on the study by Ashraf et al. (2024), a 50% threshold was chosen for this hyperparameter to balance the trade-off between false positives and false negatives. The Overlap Threshold defines the minimum overlap between the predicted and actual bounding boxes for a prediction to be accepted as correct. Predictions that overlap below this threshold are discarded (Microsoft, 2024). According to Pejčinović (2019), the optimal balance between precision and recall is achieved with 30% to 40% overlap. Therefore, this study adopted a value of 30% for this hyperparameter, as recommended by Pejčinović (2019).
Models training and testing
This step consisted of creating the models in Microsoft Custom Vision, training and testing the models, and evaluating the software’s performance based on the data obtained. This process was carried out in five steps (Figure 6). In step 1, the project is created. Then, in step 2, the field data is uploaded, adhering to the maximum file size of 3 MB required by Microsoft Custom Vision. After uploading the images, step 3 uses the object detection tool, where the user manually labels the classes to train the algorithm. Step 4 sets the training duration, and the model’s learning process begins. Finally, in step 5, the trained model is tested using a new dataset. This study used ten images per class to evaluate the model’s accuracy against the classes trained in the initial dataset.

The last step consists of testing the trained model, in which different images from the training set are used to evaluate the probability of correct recognition. In addition to predicting classes directly, some ML models generate probability vectors of membership in each class for each observation in the sample. The predicted class of each observation is the class that exceeds a parameter established by the researcher. This parameter is called threshold value. Changing the value of this parameter increases or decreases the sensitivity in recognizing labeled classes.
During this training process, the Microsoft Custom Vision algorithm is taught which class of defects it seeks to recognize automatically. After this process, it is possible to evaluate the model’s performance created in Microsoft Custom Vision using the precision, recall, and mAP indicators. A model’s Precision (Equation 1) measures the proportion of correct positive predictions relative to total predictions, highlighting its ability to avoid mislabeling negative samples as positive (Handelman et al., 2019). The Recall (Equation 2) represents the proportion of correct positive predictions about all possible positive predictions, revealing the positive predictions not captured. To bring a harmonic mean between precision and recall, the F1 Score metric was used (Equation 3). mAP, or mean Average Precision (Equation 4), is a useful metric for object detection systems as it incorporates a trade-off between precision and recall, accounting for false positives and false negatives (Handelman et al., 2019). The following Equations represent these metrics:
The software presents these indicators individually, that is, per labeled object. In addition to the indicators for each label, Microsoft Custom Vision calculates an average of the indicators for each label relating to the number of images used. It presents a general value for the model.
Results
This section presents the main results regarding the model training and testing.
Performance of models during training and testing stages
Table 5 presents the KPIs for each model anomaly, considering four hours of training. In addition to the training time, the hyperparameters used in the training were 50% Threshold Probability and 30% Overlap Threshold, both tuned in Microsoft Custom Vision. Figure 7 shows an overview of the results of each trained model and their test values. Model evaluations were performed based on F1-Score and mAP values.

Although Table 5 presents the individual performance by class, the evaluation will be based on the overall values of each model. In Microsoft Microsoft Custom Vision, this overall precision, recall, F1Score, and mAP values are obtained by aggregating the individual class performances. Precision, recall, and F1-Score are calculated as weighted averages, considering the number of examples in each class, while the mAP reflects the average of the average precisions (AP) of all classes. When there is an imbalance, classes with more examples have a greater impact on the final result, even if minority classes perform poorly.
Figure 7 presents a graph that compares the eight anomaly detection models (MO1, MO2, M11, M12, M13, M14, MDA1, and MDA2) across various performance metrics, including precision, recall, F1 Score, mAP, and test performance. The analysis details the strengths and weaknesses of each model based on these metrics.
The MO1 model achieved moderate performance during training, with an F1 Score of 58.9% and a mAP of 65.1%. However, its performance during testing was null, revealing an inability to generalize the labeled classes. The model made significant detection errors during testing, including mistaking a PVC pipe for exposed rebar (Figure 8). This error highlights a clear weakness in recognizing the trained classes. Furthermore, the model needed to correctly identify all other classes during testing, indicating that the learning achieved during training needed to be improved to handle unseen data.

A closer analysis suggests a high occurrence of False Positives (FP), where the model incorrectly assigned labels to unrelated objects, and False Negatives (FN), where it failed to detect objects belonging to the expected classes. When analyzing the results of this model, it was observed that the Exposed Reinforcement class had more FP due to its characteristics, such as voids in the concrete, exposed steel structure, and shadows within the voids. These features can be confused with floor joints, other void elements like PVC pipes, and other metallic surfaces present on the wall. On the other hand, cracks showed a higher occurrence of FN, mainly due to their thin and irregular thickness, which makes them difficult for the model to detect, especially in images with complex lighting and textures.
These results point to issues such as insufficient diversity in the training dataset or limitations in the model architecture, which may not have effectively captured the distinguishing features of each class. Together, these factors contributed to the poor overall performance and underscore the need for improvements in both the dataset and the model.
On the other hand, MO2 demonstrated superior performance, achieving 44.4% in the tests and becoming the first model to show some capability for generalization to new data. Unlike the previous models, MO2 stood out for its higher probability of automated anomaly recognition. The model showed significant advancement with 51.8% precision, 68.5% recall, and a mAP of 65.0% during training. The tests successfully recognized up to 87.2% of exposed rebar and 74.3% of concrete nests (Figure 9). This improvement may be attributed to the greater uniformity of the training database, which contained exclusively images of concrete walls and a more balanced distribution of images per label. This facilitated the model’s memorization and performance.

The individual models, composed of a single anomaly class, showed good indicators. MI1 (Figure10a), which uses only images of exposed rebar, achieved a performance of 33.4% in the tests, with an F1 Score of 59.7% and a mAP of 70.9% during training, demonstrating a slight improvement compared to MO1. MI2 (Figure10b), consisting solely of images showing the lack of removal of debris, excelled with an F1 Score of 76.0% and a mAP of 79.1%, along with a robust performance of 57.0% in the tests, validating the model’s effectiveness both during training and in application to new data. On the other hand, MI3 (Figure10c), composed exclusively of images of cracks, presented a very low F1 Score of 28.4%, reflecting the difficulty in predicting cracks, with a mAP of 61.2% and one of the worst test performances, achieving only 8.0%, highlighting the challenges mentioned in crack detection. Finally, MI4 (Figure10e), which contains only images of concrete segregation, produced mixed results: an F1 Score of 75.3% and a very high mAP of 98.1%, making it the best among all models during training. However, its test performance was only 48.0%, indicating a lower-than-expected capacity for generalization given the high mAP.

The models formed using Data Augmentation techniques, MDA1 and MDA2, exhibited mixed performances. MDA1 achieved an F1 Score of 48.4% and a mAP of 68.1%, but it had a low performance in the tests (12.4%). MDA2, on the other hand, reached the highest F1 Score among these models (78.7%), although it had a relatively lower mAP of 61.9% and a performance of 20.81% in the tests. Although MDA2 used the largest number of images during training, its performance was similar to that of the other models, making it the least accurate. Furthermore, it failed to predict anomalies during testing or predicted with low KPI (Figure 11), presenting only a 20.81% average probability of recognition of the labeled classes. This difficulty may have been caused by the confusion generated by the many images that addressed subtle anomalies in concrete walls. Another hypothesis for the reduced performance is related to the use of Data Augmentation techniques, which, although they increased the data set, perhaps needed to be more appropriate, since the images were the same, only the angle changed.

When analyzing the mAP (Mean Average Precision) values regarding the number of images used for model training, it becomes clear that increasing the number of images only sometimes results in a direct improvement in performance (Figure 12). The graph reveals a non-linear relationship between the number of images used for training and the mAP value. Models with relatively fewer images, such as MO1 (198 images) and MI4 (303 images), showed higher mAP performance, with values of 83.9% and 98.1%, respectively. However, it is important to consider that a larger dataset often provides better variability of scenes, which can improve the model’s generalization capacity and robustness. High performance in a limited dataset does not guarantee similar results in future use, where the model may encounter unseen scenarios or suffer from overfitting due to insufficient variability in the training data. This highlights the importance of balancing dataset quality, relevance, and diversity to achieve reliable performance.

Models with more images, such as MO2 (720 images) and MDA1 (1,188 images), experienced a significant drop in mAP, with 65% and 68.1%, respectively. The MDA2 model, which used the most images (4320), recorded the lowest mAP among all models, reaching only 61.9%. These results indicate that while increasing the number of images can enhance dataset diversity, it may also introduce confusion in the model, especially when the anomalies to be detected are subtle. Data Augmentation techniques, as in the case of MDA2, may have needed to be sufficient to improve performance, reinforcing the importance of a proper balance between quantity, quality, and diversity of the images.
Discussion
This study investigates the integrated use of Unmanned Aerial Systems (UAS) and Convolutional Neural Networks (CNN) to automate the detection and classification of four anomalies in facades of in-situ cast concrete walls, aiming to provide real-time information to support managers in the Quality Management System. Combining these technologies offers several advantages for the construction sector, such as reducing risky activities by replacing traditional visual and manual inspections (like scaffolding or lifts) and automating analysis through Artificial Intelligence algorithms, thereby eliminating inspector subjectivity. As a result, integrating these tools led to creating eight CNN models using images collected by UAS during the execution of three projects that employed in-situ cast concrete wall systems.
Compared to existing studies in the literature, this research presents several innovations in its approach and findings. First, this study addresses the gap Nwaogu et al. (2023) identified regarding the need for more research utilizing UAS in Quality Management Systems (QMS). UAS has made data acquisition processes much more efficient, eliminating the need to work at height to inspect facades and generate data that can support both QMS and activities related to safety and productivity. During this research’s development, the importance and utility of this equipment in generating timely information became evident. Furthermore, UAS eliminates safety concerns, slow data collection, and poor data quality, aligning with previous studies (Ruiz et al., 2020; Nwaogu et al., 2023).
In addition to the use of UAS during the construction of buildings, another contribution of this research lies in using CNN algorithms for automated image analysis. Eight models using AlexNet and ResNet architectures were proposed, with the best-performing model achieving 58.99% F1-Score and 65.00% mAP. Compared to the studies in Blackground section, the model proposed in this work presents lower precision (Table 6). However, the model presented has some peculiarities that could impact its accuracy, as discussed below.
The models developed in this research present characteristics that significantly differentiate them from these studies, even considering the limitations of the indicators obtained. While previous works used images in which anomalies were captured in high definition and with clearly visible problems, the proposed model was based on images captured by UAS at a minimum distance of 4.5 meters from the object of interest. Figure 13 shows an example of the images used in the models by Kung et al. (2021), Guo et al. (2020), Chen et al. (2021), Sousa, Sousa and Maués (2022), Wei et al. (2023), Tang et al. (2024), Katsigiannis et al. (2023), Wang et al. (2024), Mathur, Sharma and Azeemuddin (2024) and D’Orazio et al. (2024), respectively. Figure 14 shows an example of the image used in this study. This scenario resembles a real inspection, where issues captured in the images often feature lower resolution due to the distance and challenging angles, making automated recognition more complex. This means that distant objects occupy less space in images and are depicted with fewer pixels, impacting sharpness and visual detail.


Close-range image collection, as commonly used in prior research, leads to a proliferation of similar images, creating inefficiencies in documentation, excessive computational demands, and potential biases in data analysis. Moreover, it complicates the representation of real-scale facades and the localization of anomalies across the entire structure. Although the proposed models demonstrated some inaccuracies in detecting anomalies in this study, the methodology offers greater replicability and practicality for real-world applications, addressing challenges associated with large-scale facade inspections.
A key challenge in this research was implementing a UAS-based image acquisition protocol designed to standardize image capture. This protocol required images to be taken from a considerable distance from the facades, which limited the algorithm’s ability to detect anomalies with precision. In contrast, the literature review revealed that most previous studies relied on images captured at close range, with evident anomalies. While this approach yielded impressive performance metrics, it does not align well with practical inspection scenarios, where facades are often extensive, and inspections require images captured at regular intervals with overlapping views for comprehensive coverage.
Inspecting cast-in-place concrete walls presents unique challenges for machine learning algorithms due to the visual similarities between anomalies and the material’s natural patterns. However, it is important to note that this observation is based on a relatively small database, which may limit the generalizability of these findings. Regarding the surface of the facades, these similarities increase the likelihood of misclassifying defects or failing to accurately identify anomalies, underscoring the need for more robust solutions tailored to this application. For instance, the marks left by wooden or metal formwork during construction often resemble defects, making it difficult for convolutional neural network (CNN) algorithms to discern actual anomalies. This was evident in the low performance of our models when detecting and classifying cracks, where formwork marks likely contributed to algorithmic confusion.
In contrast, facades with more distinct visual characteristics, such as those analyzed in studies by Katsigiannis et al. (2023), Sousa, Sousa and Maués (2022), Wang et al. (2024), and D’Orazio et al. (2024), facilitate the identification of anomalies. Katsigiannis (2023) and D’Orazio (2024) focused on brick-clad facades (Figures 13g and 13j, respectively), where anomalies exhibit features that are easily distinguishable from the cladding. Similarly, Sousa, Sousa and Maués (2022) and Wang et al. (2024) studied ceramic cladding detachment (Figures 13d and 13h, respectively), where the specific colors and patterns of ceramic cladding, compared to plastered walls, simplified the algorithm’s learning process.
Adopting the data augmentation (DA) technique to expand the database achieved its intended purpose, increasing the original database from 720 images to 4,320 images. Another goal of this technique was to enhance the models in Microsoft Custom Vision and improve performance metrics. However, this did not occur, as the two models that utilized this technique showed the lowest performance indicators compared to the other models. In contrast to the literature, where this technique resulted in improved indicators following its application and increased the database size (Guo et al., 2020; Chen et al., 2021; Katsigiannis et al., 2023), those studies employed various techniques beyond just angle changes and did not deal with images featuring such subtle and similar issues. Therefore, the reduction in indicator values observed in this project may be attributed to the characteristics of the subject matter or the techniques used since this study relied solely on image rotation for augmentation.
Conclusions
This study proposes an automated model based on Convolutional Neural Networks (CNN) to detect and classify four anomalies in in-situ cast concrete facades during construction, aiming to accelerate decision-making in the Quality Management System (QMS). For model development, over 2,080 images of facades were collected during more than 7 hours of Unmanned Aerial Systems (UAS) flights at construction sites. From these images, 720 containing anomalies were selected to create nine models with varying amounts of data to evaluate which would perform best. The MO2 model achieved 51.80% precision, 68.50% recall, 65.00% mAP, and an F1 score of 58.99% during training, making it the most accurate model during testing and the best among the nine.
Unlike previous studies, this research innovates in inspecting cast-in-place concrete facades during the construction phase by presenting an optimized method of data acquisition using UAS, facilitating manual and automated analyses. Detailed protocols were developed for collecting images, using CNN to identify defects, and addressing multiple labels. From a practical point of view, this research advances the integration of digital technologies into construction management processes by improving information generation in the QMS in real projects, thus supporting managers’ decision-making.
The main limitation of this research was the use of a closed platform for model development. Although Custom Vision significantly contributed to the progress of this study, more detailed information about the models is required to make adjustments that could improve performance indicators (KPIs). In this regard, future studies could focus on developing a custom CNN architecture or exploring solutions that allow fine-tuning hyperparameters and layer configurations to achieve higher performance metrics. Besides, future research should fully integrate the workflow of the proposed method, enabling the automated analysis of UAS-collected images using CNN algorithms and the automatic generation of reports based on these analyses. Expanding the database in subsequent studies could also help minimize model errors and enhance performance metrics.
Acknowledgments
The authors would like to thank the Ministry of Education through the Coordination for the Improvement of Higher Education Personnel (CAPES) and the Foundation for Research Support of the State of Bahia (FAPESB) for granting research scholarships, the National Council for Scientific and Technological Development (CNPq) for providing financial resources (Project 402380/2021-5), and MRV Engenharia for their support in the study.
References
- ASHRAF, A. R. et al. Leveraging code-free deep learning for pill recognition in clinical settings: A multicenter, real-world study of performance across multiple platforms. Artificial Intelligence in Medicine, p. 102844, 2024.
- ASSOCIAÇÃO BRASILEIRA DE NORMAS TÉCNICAS. NBR 16747: inspeção predial: diretrizes, conceitos, terminologias e procedimentos. Rio de Janeiro, 2020.
- BADUGE, S. K. et al. Artificial intelligence and smart vision for building and construction 4.0: Machine and deep learning methods and applications. Automation in Construction, v. 141, p. 104440, 2022.
- CHEN, K. et al. Automated crack segmentation in close-range building façade inspection images using deep learning techniques. Journal of Building Engineering, v. 43, p. 102913, 2021.
- CHEN, K. et al. GIS-based information system for automated building façade assessment based on unmanned aerial vehicles and artificial intelligence. Journal of Architectural Engineering, v. 29, n. 4, p. 04023032, 2023.
- CUSUMANO, L. et al. Current benefits and future possibilities with digital field reporting. International Journal of Construction Management, p. 1-12, 2024.
- D’ORAZIO, M. et al. Automatic monitoring of the biocolonisation of historical building’s facades through convolutional neural networks (CNN). Journal of Cultural Heritage, v. 70, p. 80-89, 2024.
- GUO, J. et al. Façade defects classification from imbalanced dataset using meta learning‐based convolutional neural network. Computer‐Aided Civil and Infrastructure Engineering, v. 35, n.12, p.1403-1418, 2020.
- HANDELMAN, G. S. et al. Peering into the black box of artificial intelligence: evaluation metrics of machine learning methods. American Journal of Roentgenology, v. 212, n. 1, p. 38-43, 2019.
- HE, K. et al. Deep residual learning for image recognition. In: IEEE CONFERENCE ON COMPUTER VISION AND PATTERN RECOGNITION, Las Vegas, 2016. Proceedings […] Las Vegas, 2016.
- KATSIGIANNIS, S. et al. Deep learning for crack detection on masonry façades using limited data and transfer learning. Journal of Building Engineering p. 107105, 2023.
- KO, P.; PRIETO, S. A.; SOTO, B. G. Developing a Free and Open-Source Semi-Automated Building Exterior Crack Inspection Software for Construction and Facility Managers. IEEE Access v. 11, p. 77099-77116, 2023.
- KRIZHEVSKY, A.; SUTSKEVER, I.; HINTON, G. E. Imagenet classification with deep convolutional neural networks. Advances in Neural Information Processing Systems, v. 25, 2012.
- KUNG, R.-Y. et. al. Application of deep learning and unmanned aerial vehicle on building maintenance. Advances in Civil Engineering, v. 2021, n. 1, p. 5598690, 2021.
- LECUN, Y.; BENGIO, Y.; HINTON, G. Deep learning. Nature, v. 521, n. 7553, p. 436-444, 2015.
- LEMOS, R. et al. Automatic detection of corrosion in large-scale industrial buildings based on artificial intelligence and unmanned aerial vehicles. Applied Sciences, v. 13, n. 3, p. 1386, 2023.
- LI, C. Z. et al. The application of advanced information technologies in civil infrastructure construction and maintenance. Sustainability, v. 14, n.13, p. 7761, 2022.
-
LIAKHOVICH, O.; MBEMBA, C. Food classification with Microsoft Custom Vision service Microsoft Developer Blog, 12 may 2017. Available: https://www.microsoft.com/developerblog/2017/05/12/food-classification-custom-vision-service/ Access: 15 set. 2023.
» https://www.microsoft.com/developerblog/2017/05/12/food-classification-custom-vision-service/ - MA, Z.; LIU, Y.; LI, J. Review on automated quality inspection of precast concrete components. Automation in Construction, v. 150, p. 104828, 2023.
- MATHUR, P.; SHARMA, C.; AZEEMUDDIN, S. Autonomous inspection of high-rise buildings for façade detection and 3D modeling using UAVs. IEEE Access, v. 12, n. 12, p. 18251-18258, 2024.
- MELO, R. R. S. et al. Applicability of Unmanned Aerial System (UAS) for safety inspection on construction sites. Safety Science, v. 98, p. 174-185, 2017.
-
MICROSOFT. Microsoft Custom Vision® 2024. Available: https://learn.microsoft.com/en-us/azure/ai-services/custom-vision-service/overview Access: 04 mar. 2025.
» https://learn.microsoft.com/en-us/azure/ai-services/custom-vision-service/overview - MÜLLER, A. C.; GUIDO, S. Introduction to machine learning with Python: a guide for data scientists. New York: O’Reilly Media, 2016.
- MUNAWAR, H. S. et al. Infrastructure Damage and Corrosion Detection: An Application of Machine Learning. Buildings, v. 12, p. 156, 2022.
- NWAOGU, J. M. et al. Application of drones in the architecture, engineering, and construction (AEC) industry. Automation in Construction, v. 150, p. 104827, 2023.
- OCHOA, S. F. et al. Coordinating loosely-coupled work in construction inspection activities. Group Decision and Negotiation, v. 20, p. 39-56, 2011.
- PEJČINOVIĆ, M. A review of custom vision service for facilitating an image classification. In: CENTRAL EUROPEAN CONFERENCE ON INFORMATION AND INTELLIGENT SYSTEMS, 30., Varazdin, 2019, Proceedings […] Varaždin, 2019.
- RUBIO, J. J. et al. Multi-class structural damage segmentation using fully convolutional networks. Computers in Industry, v. 112, p. 103121, 2019.
- RUIZ, R. D. B. et al. Processamento digital de imagens para detecção automática de fissuras em revestimentos cerâmicos de edifícios. Ambiente Construído, Porto Alegre, v. 21, n. 1, p. 139-147, jan./mar. 2020.
- SALEEM, M. R.; MAYNE, R.; NAPOLITANO, R. Analysis of gaze patterns during facade inspection to understand inspector sense-making processes. Scientific Reports, v. 13, n. 1, p. 2929, 2023.
- SANTOS, R. et al. Detection of exposed steel rebars based on deep-learning techniques and unmanned aerial vehicles. Automation in Construction, v. 139, p. 104324, 2022.
- SILVA, A. D. S. et al. Modelo de Aprendizado de Máquina para inspeção automatizada de fachadas de paredes de concreto. In: SIMPÓSIO BRASILEIRO DE GESTÃO E ECONOMIA DA CONSTRUÇÃO, 13., Aracajú, 2023. Anais [...] Aracajú, 2023.
- SILVA, A. S. Método para reconhecimento automatizado de falhas construtivas na execução de fachadas com uso de drones e Aprendizado de Máquina Salvador, 2023. 181f. Dissertação (Mestrado em Engenharia Civil) – Universidade Federal da Bahia, Salvador, 2023.
- SILVA, A. S.; COSTA, D. B. Análise do uso de tecnologias digitais para identificação automatizada de patologias em construções. In: ENCONTRO NACIONAL DE TECNOLOGIA DO AMBIENTE CONSTRUÍDO, 19., Canela, 2022. Anais [...] Canela, 2022.
- SOUSA, A. D. P. D.; SOUSA, G. C. L. D.; MAUÉS, L. M. F. Using digital image processing and Unmanned Aerial Vehicle (UAV) for identifying ceramic cladding detachment in building facades. Ambiente Construído, Porto Alegre, v. 22, n. 2, p. 199-213, abr./jun. 2022.
- STAFFA, L. B. J. et al. Web platform for building roof maintenance inspection using UAS and artificial intelligence. International Journal of Building Pathology and Adaptation, v. 43, n. 1, p. 4-28, 2023.
- TANG, H. et al. A CNN-based network with attention mechanism for autonomous crack identification on building facade. Nondestructive Testing and Evaluation, v. 39, n. 1, p. 75-89, 2024.
- TEKIN, H. Assessment of risks in building inspection services during and post-COVID-19 pandemic. Journal of Risk and Uncertainty in Engineering Systems, Part A: Civil Engineering, v. 8, n. 2, p. 04022003, 2022.
- VALERO, E. et al. Automated defect detection and classification in ashlar masonry walls using machine learning. Automation in Construction, v. 106, p. 102846, 2019.
- WANG, J. et al. Automatic detection of building surface cracks using UAV and deep learning‐combined approach. Structural Concrete, v. 25, n. 4, p. 2302-2322, 2024.
- WEI, G. et al. Bfd-Yolo: a Yolov7-based detection method for building façade defects. Electronics, v. 12, n. 17, p. 3612, 2023.
- YIN, R. K. Estudo de caso: planejamento e métodos. Bookman editora, 2015.
- YUAN, X. et al. Automatic evaluation of rebar spacing using LiDAR data. Automation in Construction, v. 131, p. 103890, 2021.
Edited by
-
Editor:
Enedir Ghisi
-
Editora de seção:
Luciani Somensi Lorenzi
Publication Dates
-
Publication in this collection
07 Apr 2025 -
Date of issue
Jan-Dec 2025
History
-
Received
15 Oct 2024 -
Accepted
03 Jan 2025